Download
1 / 19
190 likes | 502 Views
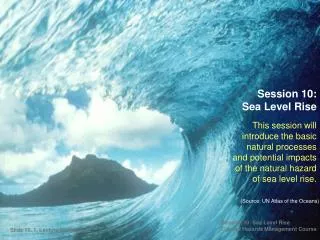
Sea Level Rise in Galveston, Miami and New York. Maelle LIMOUZIN November 18, 2008. Background on sea level rise. Consequence of global warming through two principal processes: Thermal expansion of water Melting of glacial ice

E N D
Sea Level Rise in Galveston, Miami and New York Maelle LIMOUZIN November 18, 2008
Background on sea level rise • Consequence of global warming through two principal processes: • Thermal expansion of water • Melting of glacial ice • Great differences due to currents and coasts and sea-beds configurations • Possible consequences : • Important floods in many cities and islands in the world, • Change in groundwater quality, • Losses of natural coastal habitats and coastal erosion…
Sea level trends From NOAA tides and currents
Data • National Elevation Dataset from USGS seamless server • Shorelines from National Geodetic Survey NOAA Shoreline Data Explorer • Roads and Rails from ESRI Census 2000 TIGER/Line® Shapefiles • Land cover use from USGS
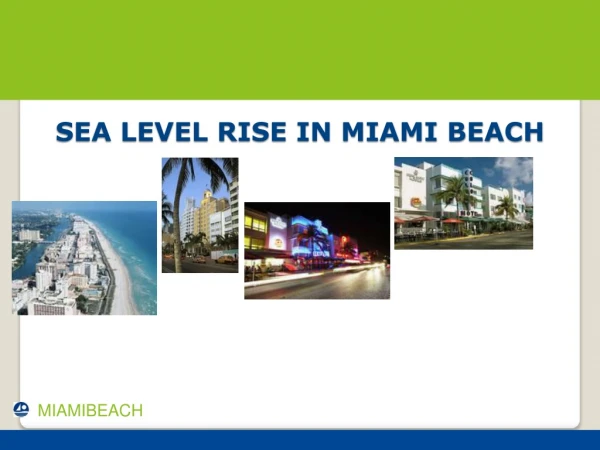
Miami map 8 different layers = 8 different scales -> adapted display Miami
Galveston map Galveston
Land cover use cultivated crops developed area Emergent herbaceous wetlands
Suggestions for Galveston • Levees and dikes around critical areas • Seal off the entire Galveston Bay during storm attack as in Netherlands
Conclusions • Sea level rise can be a real threat • Populations may have to be displaced • Long-term solutions have to be found during the next decades HOWEVER, • Estimation really approximate • Future behavior unknown
Future work • New York map • More precise analysis of the consequences • Suggest solutions for Miami and New York
Sea Level Rise in Galveston, Miami and New York Questions ? vvv vvv vvv