Download
1 / 11
110 likes | 176 Views
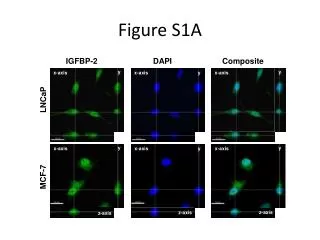
Table S1A : Data of growth property. Table S1B : Statistical P- value of growth property. Table S2A: Sensitivity to ionizing radiation. Table S2B: statistical P- value of sensitivity to ionizing radiation. Table S5A: Number of IR induced Rad51 focus formations per cell.

E N D
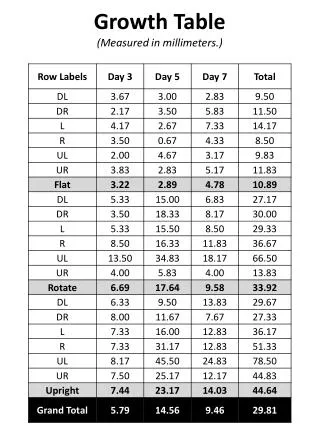
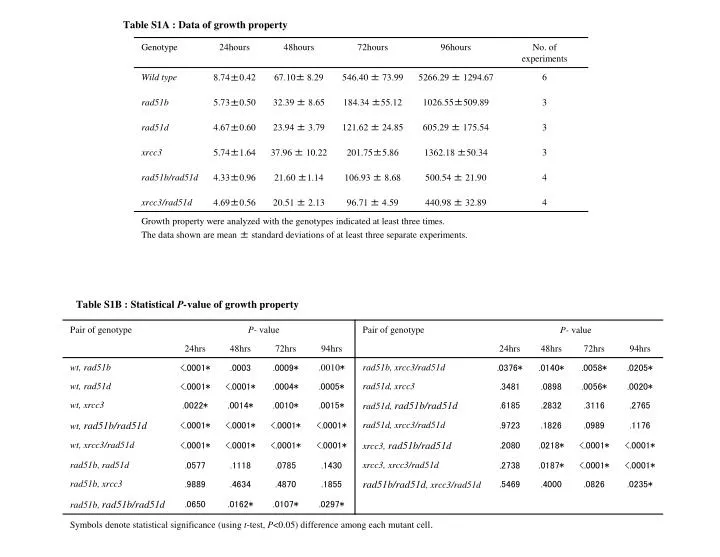
Table S1A : Data of growth property Table S1B : Statistical P-value of growth property
Table S2A: Sensitivity to ionizing radiation Table S2B: statistical P-value of sensitivity to ionizing radiation
Table S5A: Number of IR induced Rad51 focus formations per cell Table S5B: statistical P-value of ionizing radiation induced Rad51 focus formation
Table S6A: Number of ionizing radiation induced Rad54 focus formations per cell Table S6B: statistical P-value of ionizing radiation induced Rad54 focus formation
Table S7A: Number of CDDP induced Rad51 focus formations per cell Table S7B: statistical P-value of CDDP induced Rad51 focus formation
Table S8A: Number of CDDP induced Rad54 focus formations per cell Table S8B: statistical P-value of CDDP induced Rad54 focus formation
Table S3A: Data of CDDP sensitivity Table S3B: statistical P-value of CDDP sensitivity
Table S4A: Data of CPT sensitivity Table S4B: statistical P-value of CPT sensitivity
Table S10A: CDDP induced chromosomal aberrations Table S10B: statistical P-value of CDDP induced Chromosomal aberration
Table S11A: CPT induced chromosomal aberrations Table S11B: statistical P-value of CPT induced Chromosomal aberration