Download
1 / 5
50 likes | 214 Views
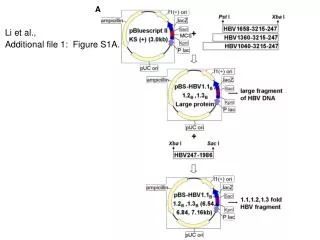
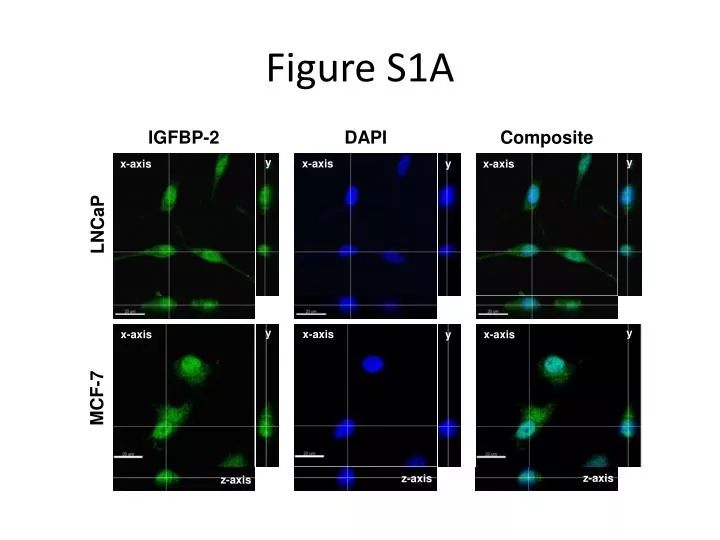
Figure S1A. IGFBP-2. DAPI. Composite. y. y. x-axis. x-axis. y. x-axis. x-axis. x-axis. x-axis. LNCaP. y. y. y. MCF-7. z-axis. z-axis. z-axis. Figure S1B:.

E N D
Figure S1A IGFBP-2 DAPI Composite y y x-axis x-axis y x-axis x-axis x-axis x-axis LNCaP y y y MCF-7 z-axis z-axis z-axis
Figure S1B: (S1A) 3D confocal analysis of IGFBP-2 immunofluorescence in LNCaP and MCF-7 cells. Confirmation that nuclear IGFBP-2 staining is due to intranuclear, and not cell membrane bound, IGFBP-2. (S1B) 3D animations of IGFBP-2 immunofluorescence in LNCaP cells showing intranuclear localization of IGFBP-2.
Figure S2 S2. Import assay of IGFBP-3 was carried out, in parallel to the IGFBP-2 import assay, as a positive control. As previously described, IGFBP-3 requires ATP and cytosolic factors for nuclear translocation. Digitonin-permeabilized SHEP cells were incubated with full length IGFBP-3 in the presence of cytosol and an ATP-regenerating system. We examined depletion of ATP and cytosol from the import assay. Transport studies were also carried out with the addition of anti-importin α/β in the presence or absence of RRL respectively. Images are representative of at least three independent experiments. Cells were visualised by a laser scanning confocal microscope (Leica TCS SP2 SE, objective X40).
Figure S3 Anti-IGFBP-3 DAPI Composite A (+) IgG Anti-IGFBP-2 DAPI Composite B (+) IgG S3 . Transport studies were carried out with the addition of anti-importin α/β in the presence or absence of RRL respectively, to determine their function in the nuclear import of IGFBP-2 and -3. IgG was used as a negative control to demonstrate the specific blocking effects of anti-importin α and β. Images are representative of at least three independent experiments. Cells were visualised by a laser scanning confocal microscope (Leica TCS SP2 SE, objective X40).
Figure S4 IP IGFBP-2 Unbound IP IGFBP-2 IP Importin-a Input Unbound Unbound IGFBP-2 Bound Bound Input WIB IGFBP-2 32 kDa 32 kDa WIB Importin a 60 kDa Figure S4. IGFBP-2 /Importin a complexes: The presence of IGFBP-2/importin-α complexes in SHEP cells over-expressing IGFBP-2 was demonstrated by immunoprecipitation as described in Materials and Methods. The IP with anti-IGFBP-2 resolved immunoreactive bands (Bound) for IGFBP-2 (Top panel; 32kDa band) and importin-α (Bottom panel; 60kDa band). Cell extract starting material (Input) and post IP material (Unbound) and purified IGFBP-2 (10 ng) were also include as controls. The right panel shows, in reduced scale, lanes of the WIB for the Input and Unbound samples to provide evidence for specificity of the anti-IGFBP-2 antibody (32 kDa band). Correspondent lanes for Input and Unbound samples in the top and in the right panels (full size immunoblotting membrane) are demarked by a dotted red line.