Download
1 / 9
90 likes | 94 Views
Insecticides India Limited: Check out the institutional research report of Q4 result of Insecticides India Ltd. Insecticides India (INST) 4QFY18 revenue was at Rs 3.1bn (up 2.3% YoY). Revenue growth was muted due to lower concentration of Generic products

E N D
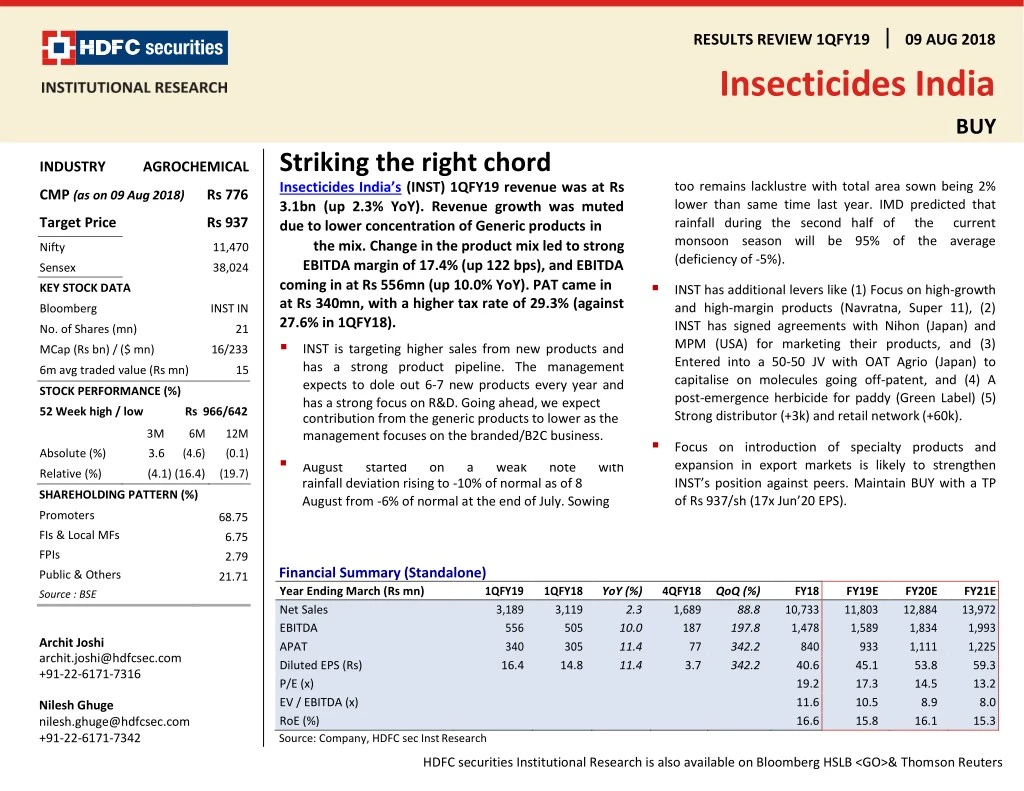
RESULTS REVIEW 1QFY19 Insecticides India 09 AUG 2018 BUY Striking the right chord Insecticides India’s (INST) 1QFY19 revenue was at Rs 3.1bn (up 2.3% YoY). Revenue growth was muted due to lower concentration of Generic products in the mix. Change in the product mix led to strong EBITDA margin of 17.4% (up 122 bps), and EBITDA coming in at Rs 556mn (up 10.0% YoY). PAT came in at Rs 340mn, with a higher tax rate of 29.3% (against 27.6% in 1QFY18). ▪INST is targeting higher sales from new products and has a strong product pipeline. The management expects to dole out 6-7 new products every year and has a strong focus on R&D. Going ahead, we expect contribution from the generic products to lower as the management focuses on the branded/B2C business. INDUSTRY AGROCHEMICAL too remains lacklustre with total area sown being 2% lower than same time last year. IMD predicted that rainfall during the second half of the current monsoon season will be 95% of the average (deficiency of -5%). CMP (as on 09 Aug 2018) Rs 776 Target Price Rs 937 Nifty 11,470 Sensex 38,024 ▪INST has additional levers like (1) Focus on high-growth and high-margin products (Navratna, Super 11), (2) INST has signed agreements with Nihon (Japan) and MPM (USA) for marketing their products, and (3) Entered into a 50-50 JV with OAT Agrio (Japan) to capitalise on molecules going off-patent, and (4) A post-emergence herbicide for paddy (Green Label) (5) Strong distributor (+3k) and retail network (+60k). KEY STOCK DATA Bloomberg INST IN No. of Shares (mn) 21 MCap (Rs bn) / ($ mn) 16/233 6m avg traded value (Rs mn) 15 STOCK PERFORMANCE (%) 52 Week high / low Rs 966/642 3M 6M 12M (0.1) ▪Focus on introduction of specialty products and expansion in export markets is likely to strengthen INST’s position against peers. Maintain BUY with a TP of Rs 937/sh (17x Jun’20 EPS). Absolute (%) 3.6 (4.6) ▪ August started on a weak note with Relative (%) (4.1) (16.4) (19.7) rainfall deviation rising to -10% of normal as of 8 August from -6% of normal at the end of July. Sowing SHAREHOLDING PATTERN (%) Promoters 68.75 6.75 2.79 21.71 FIs & Local MFs FPIs Financial Summary (Standalone) Year Ending March (Rs mn) Net Sales EBITDA APAT Diluted EPS (Rs) P/E (x) EV / EBITDA (x) RoE (%) Source: Company, HDFC sec Inst Research Public & Others 1QFY19 3,189 556 340 16.4 1QFY18 3,119 505 305 14.8 YoY (%) 4QFY18QoQ (%) 1,689 187 77 3.7 FY18 10,733 1,478 840 40.6 19.2 11.6 16.6 FY19E 11,803 1,589 933 45.1 17.3 10.5 15.8 FY20E 12,884 1,834 1,111 53.8 14.5 8.9 16.1 FY21E 13,972 1,993 1,225 59.3 13.2 8.0 15.3 Source : BSE 2.3 10.0 11.4 11.4 88.8 197.8 342.2 342.2 Archit Joshi archit.joshi@hdfcsec.com +91-22-6171-7316 Nilesh Ghuge nilesh.ghuge@hdfcsec.com +91-22-6171-7342 HDFC securities Institutional Research is also available on Bloomberg HSLB <GO>& Thomson Reuters
INSECTICIDES INDIA : RESULTS REVIEW 1QFY19 Quarterly Financials Snapshot (Standalone) (Rs mn) Net Sales Material Expenses Stock In Trade Employee Expenses Other Expenses EBITDA Depreciation EBIT Other Income (Including EO Items) Interest Cost PBT Tax RPAT EO (Loss) / Profit (Net Of Tax) APAT AEPS (Rs/sh) Source: Company, HDFC sec Inst Research 1QFY19 3,189 1,877 326 149 282 556 1QFY18 3,119 2,050 154 127 283 505 YoY (%) 4QFY18 1,689 1,514 (348) 116 221 187 QoQ (%) 88.8 24.0 (193.6) 28.1 27.5 197.8 2.3 (8.4) 111.7 17.7 (0.5) 10.0 12.3 9.8 (70.2) (38.4) 14.0 20.6 11.4 Revenue growth was muted due to change in product mix. Lower sales from Generic (high volume, low margin) products impacted Net sales. 48 508 1.8 29 480 141 340 43 462 6.1 47 422 117 305 47 139 3.6 28 115 38 77 1.7 264.6 (49.9) 3.5 318.2 269.5 342.2 Lower interest costs came in due to focus on debt reduction. - - - - - 340 16.4 305 14.8 11.4 11.4 77 3.7 342.2 342.2 Margin Analysis (% Of Net Sales) Material Expenses As % Of Net Sales Stock In Trade As % Of Net Sales Employee Expenses As % Of Net Sales Other Expenses As % Of Net Sales EBITDA Margin (%) 1QFY19 58.9 10.2 1QFY18 65.7 YoY (bps) (687) 4QFY18 89.6 (20.6) QoQ (bps) (3,074) 3,081 (221) (425) 4.9 4.1 9.1 16.2 528 61 (24) 4.7 8.8 17.4 6.9 13.1 11.0 Improvement in Gross margin and EBITDA margin on account of change in product mix. 122 638 EBIT Margin (%) Net Profit Margin (%) Tax Rate (%) Source: Company, HDFC sec Inst Research 15.9 10.7 29.3 14.8 9.8 27.6 109 88 161 8.2 4.5 33.1 768 611 (385) Page | 2
INSECTICIDES INDIA : RESULTS REVIEW 1QFY19 Quarterly Performance Revenue contribution from Formulations have remained steady at 69% of total sales. Revenues Mix Standalone Performance Formulations Technicals Net Sales Rs mn YoY Growth (RH) EBITDA Margins (RH) % 100% 90% 80% 70% 60% 50% 40% 30% 20% 10% 0% 4,500 40 12 16 14 26 17 14 15 16 14 26 17 4,000 31 35 31 30 39 41 45 3,500 20 3,000 10 2,500 88 84 86 85 84 86 74 83 86 2,000 69 74 83 - 65 69 1,500 61 59 55 -10 1,000 -20 500 - -30 1QFY15 2QFY15 3QFY15 4QFY15 1QFY16 2QFY16 1QFY17 2QFY17 1QFY18 2QFY18 1QFY19 Q4FY16 Q4FY17 Q4FY18 3QFY16 3QFY17 3QFY18 1QFY15 2QFY15 3QFY15 4QFY15 1QFY16 2QFY16 1QFY17 2QFY17 1QFY18 2QFY18 1QFY19 Q4FY16 Q4FY17 Q4FY18 3QFY16 3QFY17 3QFY18 Increased focus on high- growth products and tie-up with MNC’s will lead to better EBITDA margins, going forward Source: Company, HDFC sec Inst Research Source: Company, HDFC sec Inst Research Formulation Business Performance Technical Business Perfomance YoY Growth (RH) Formulations Technicals YoY Growth (RH) % % Rs mn 4,500 50.0 Rs mn 1,400 250.0 4,000 40.0 1,200 200.0 3,500 30.0 1,000 150.0 3,000 20.0 800 100.0 2,500 10.0 2,000 - 600 50.0 1,500 -10.0 400 - 1,000 -20.0 200 -50.0 500 -30.0 - -40.0 - -100.0 1QFY15 2QFY15 3QFY15 4QFY15 1QFY16 2QFY16 1QFY17 2QFY17 1QFY18 2QFY18 1QFY19 Q4FY16 Q4FY17 Q4FY18 3QFY16 3QFY17 3QFY18 1QFY15 2QFY15 3QFY15 4QFY15 1QFY16 2QFY16 1QFY17 2QFY17 1QFY18 2QFY18 1QFY19 Q4FY16 Q4FY17 Q4FY18 3QFY16 3QFY17 3QFY18 Source: Company, HDFC sec Inst Research Source: Company, HDFC sec Inst Research Page | 3
INSECTICIDES INDIA : RESULTS REVIEW 1QFY19 Assumptions Revenue Growth (%) Navratna + Super 11 Other Branded Sale Technical FY21E 7.0 13.0 3.7 FY16 7.0 22.6 (22.9) FY17 7.5 2.5 (7.5) FY18 2.7 10.0 (6.3) FY19E 6.2 12.0 (0.2) FY20E 8.0 15.0 2.0 Higher growth from formulations expected. 28.9 31.0 17.5 Gross Profit Margins (%) Branded Formulation (GPM %) Institutional Sales (GPM %) Source: Company, HDFC sec Inst Research Change In Estimates Rs mn Net Sales EBIDTA APAT AEPS (Rs) Source: HDFC sec Inst Research 31.6 31.0 33.8 25.3 30.0 7.2 28.9 32.0 15.1 28.3 30.5 18.0 28.9 31.0 18.0 No change in estimates as we remain watchful on the Indian Monsoons. YoY Gr (%) FY19 Old 11,803 1,589 FY19 New 11,803 1,589 YoY Gr (%) FY20 Old 12,884 1,834 1,111 53.8 FY20 New 12,884 1,834 1,111 0.0 0.0 0.0 0.0 0.0 0.0 0.0 0.0 933 45.1 933 45.1 53.8 Peer Set Comparison EPS (Rs/sh) P/E (x) ROE (%) Mcap (Rs bn) CMP (Rs/sh) TP Rating* (Rs/sh) FY19E FY20E FY21E FY19E FY20E FY21E FY19E FY20E FY21E AGROCHEMICALS UPL PI Industries Rallis India Dhanuka Agritech Insecticides India Source: Company, HDFC sec Inst Research, 324 106 40 29 16 636 780 206 589 776 BUY BUY BUY BUY BUY 700 874 275 676 937 44.8 30.1 9.8 28.0 45.1 53.6 34.9 11.8 30.7 53.8 60.7 39.1 13.9 35.0 59.3 14.2 25.9 21.0 21.0 17.2 11.9 22.3 17.5 19.2 14.4 10.5 19.9 14.8 19.3 13.1 22.7 19.8 15.6 20.1 15.8 22.6 19.4 17.4 18.9 16.1 21.5 18.4 18.4 18.5 15.3 Page | 4
INSECTICIDES INDIA : RESULTS REVIEW 1QFY19 Income Statement (Standalone) (Rs mn) Net Revenues Growth (%) Material Expenses Traded Goods Employee Expenses Other Operating Expenses EBITDA EBITDA Margin (%) EBIDTA Growth (%) Depreciation EBIT Other Income (Including EO Items) Interest PBT Tax RPAT Minority Interest EO (Loss) / Profit (Net Of Tax) APAT APAT Growth (%) AEPS AEPS Growth (%) Source: Company, HDFC sec Inst Research Balance Sheet (Standalone) (Rs mn) SOURCES OF FUNDS Share Capital Reserves Total Shareholders’ Funds Long-term Debt Short-term Debt Total Debt Long-term Provisions & Others Net Deferred Tax Liability TOTAL SOURCES OF FUNDS APPLICATION OF FUNDS Net Block CWIP Investments LT Loans & Advances Other Non-current Assets Total Non-current Assets Inventories Debtors Other Current Assets Cash & Equivalents Total Current Assets Creditors Other Current Liabilities & Provision Total Current Liabilities Net Current Assets TOTAL APPLICATION OF FUNDS Source: Company, HDFC sec Inst Research FY21E 13,972 8.4 9,114 820 656 1,390 1,993 14.3 8.7 217 1,775 FY17 9,942 0.8 5,994 1,429 455 951 1,114 11.2 24.1 160 954 FY18 10,733 FY19E 11,803 10.0 7,716 743 552 1,203 1,589 13.5 FY20E 12,884 FY17 FY18 FY19E FY20E FY21E 8.0 9.2 207 4,439 4,646 307 2,060 2,366 207 5,269 5,476 176 968 1,144 207 6,152 6,359 143 829 971 207 7,214 7,420 128 746 874 207 8,389 8,595 116 806 922 6,926 708 506 1,114 1,478 13.8 32.7 170 1,308 8,381 781 601 1,287 1,834 14.2 15.4 208 1,626 5 6 6 6 6 7.5 202 1,387 89 188 6,814 188 7,524 188 8,489 188 9,711 7,106 36 87 68 202 820 226 594 32 159 1,181 341 840 34 107 1,313 381 933 36 96 1,858 569 111 2,357 127 163 2,490 250 163 2,783 250 163 3,215 250 163 1,725 500 1,225 1,565 454 1,111 - - - - - 94 159 2,806 4,073 2,348 573 201 7,195 2,434 753 3,187 4,008 6,814 159 3,062 4,365 2,582 573 371 7,892 2,676 753 3,430 4,462 7,524 159 3,355 4,765 2,819 573 652 8,809 2,921 753 3,675 5,134 8,489 159 3,787 5,168 3,057 573 1,049 9,846 3,168 753 3,922 5,924 9,711 - - - - - - - - - - 2,632 4,258 2,116 686 1,225 10.2 59.3 10.2 594 11.4 28.7 11.4 840 41.4 40.6 41.4 933 11.0 45.1 11.0 1,111 19.2 53.8 19.2 92 7,152 1,987 691 2,678 4,474 7,106 Page | 5
INSECTICIDES INDIA : RESULTS REVIEW 1QFY19 Cash Flow (Standalone) (Rs mn) Reported PBT Non-operating & EO Items Interest Expenses Depreciation Working Capital Change Tax Paid OPERATING CASH FLOW ( a ) Capex Free Cash Flow (FCF) Investments Non-operating Income Other INVESTING CASH FLOW ( b ) Debt Issuance/(Repaid) Interest Expenses FCFE Share Capital Issuance Dividend FINANCING CASH FLOW ( c ) NET CASH FLOW (a+b+c) EO Items, Others Closing Cash & Equivalents Source: Company, HDFC sec Inst Research Key Ratios (Standalone) Ratios PROFITABILITY (%) GPM EBITDA Margin EBIT Margin APAT Margin RoE Core RoCE RoCE EFFICIENCY Tax Rate (%) Asset Turnover (x) Inventory (days) Debtors (days) Other Current Assets (days) Payables (days) Other Current Liab & Provns (days) Cash Conversion Cycle (days) Debt/EBITDA (x) Net D/E (x) Interest Coverage PER SHARE DATA (Rs/sh) EPS CEPS DPS BV VALUATION FY17 FY18 FY19E FY20E FY21E FY17 820 FY18 1,181 (1) 159 170 582 (262) 1,829 (282) 1,547 FY19E 1,313 (34) 107 202 (284) (381) 924 (500) 424 FY20E 1,565 (36) FY21E 1,725 (36) 25.3 11.2 9.6 6.0 13.7 10.6 11.2 28.9 13.8 12.2 7.8 16.6 13.6 13.7 28.3 13.5 11.7 7.9 15.8 14.3 14.1 28.9 14.2 12.6 8.6 16.1 15.4 14.7 28.9 14.3 12.7 8.8 15.3 15.3 14.1 2 202 160 (989) (170) 24 (144) (120) 96 208 (391) (454) 988 (500) 488 87 217 (394) (500) 1,099 (650) 449 27.5 1.5 156 78 25 73 25 161 2.1 0.5 4.7 28.9 1.5 139 80 19 83 26 136 0.8 0.2 8.2 29.0 1.6 135 80 18 83 23 132 0.6 0.1 12.9 29.0 1.6 135 80 16 83 21 132 0.5 0.0 16.9 29.0 1.5 135 80 15 83 20 132 0.5 (0.0) 20.5 - - - - - 68 (61) (136) 543 (207) 216 32 (9) 34 2 36 36 - - (258) (1,095) (160) 293 (464) (172) (107) 144 (464) (97) (96) 295 (614) 48 (87) 410 - - - - - - (50) (50) (329) 130 (50) (243) 281 (50) (89) 397 335 223 (1,304) 267 - - - - - 28.7 36.5 2.0 224.8 40.6 48.9 2.0 264.9 45.1 54.9 2.0 307.7 53.8 63.8 2.0 359.0 59.3 69.8 2.0 415.9 92 201 371 652 1,049 P/E (x) P/BV (x) EV/EBITDA (x) OCF/EV (%) FCF/EV (%) FCFE/MCAP (%) Dividend Yield (%) Source: Company, HDFC sec Inst Research 27.0 3.5 16.4 0.1 (0.7) 1.3 0.3 19.1 2.9 11.5 10.8 9.1 1.8 0.3 17.2 2.5 10.5 5.6 2.5 0.9 0.3 14.4 2.2 8.9 6.1 3.0 1.8 0.3 13.1 1.9 8.0 6.9 2.8 2.6 0.3 Page | 6
INSECTICIDES INDIA : RESULTS REVIEW 1QFY19 RECOMMENDATION HISTORY Date CMP 738 845 852 740 845 669 776 Reco BUY NEU NEU BUY BUY BUY BUY Target 800 815 852 927 914 914 937 Insecticides TP 11-Aug-17 21-Nov-17 9-Jan-18 13-Apr-18 29-May-18 9-Jul-18 9-Aug-18 1,100 1,000 900 800 700 600 500 Rating Definitions BUY : Where the stock is expected to deliver more than 10% returns over the next 12 month period May-18 Jun-18 Aug-18 Oct-17 Mar-18 Apr-18 Jul-18 Dec-17 Nov-17 Aug-17 Sep-17 Feb-18 Jan-18 NEUTRAL : Where the stock is expected to deliver (-)10% to 10% returns over the next 12 month period SELL : Where the stock is expected to deliver less than (-)10% returns over the next 12 month period Page | 7
INSECTICIDES INDIA : RESULTS REVIEW 1QFY19 Disclosure: We, Archit Joshi, MBA & Nilesh Ghuge, MMS, authors and the names subscribed to this report, hereby certify that all of the views expressed in this research report accurately reflect our views about the subject issuer(s) or securities. HSL has no material adverse disciplinary history as on the date of publication of this report. We also certify that no part of our compensation was, is, or will be directly or indirectly related to the specific recommendation(s) or view(s) in this report. Research Analyst or his/her relative or HDFC Securities Ltd. does not have any financial interest in the subject company. Also Research Analyst or his relative or HDFC Securities Ltd. or its Associate may have beneficial ownership of 1% or more in the subject company at the end of the month immediately preceding the date of publication of the Research Report. Further Research Analyst or his relative or HDFC Securities Ltd. or its associate does not have any material conflict of interest. Any holding in stock –No HDFC Securities Limited (HSL) is a SEBI Registered Research Analyst having registration no. INH000002475. Disclaimer: This report has been prepared by HDFC Securities Ltd and is meant for sole use by the recipient and not for circulation. The information and opinions contained herein have been compiled or arrived at, based upon information obtained in good faith from sources believed to be reliable. Such information has not been independently verified and no guaranty, representation of warranty, express or implied, is made as to its accuracy, completeness or correctness. All such information and opinions are subject to change without notice. This document is for information purposes only. Descriptions of any company or companies or their securities mentioned herein are not intended to be complete and this document is not, and should not be construed as an offer or solicitation of an offer, to buy or sell any securities or other financial instruments. This report is not directed to, or intended for display, downloading, printing, reproducing or for distribution to or use by, any person or entity who is a citizen or resident or located in any locality, state, country or other jurisdiction where such distribution, publication, reproduction, availability or use would be contrary to law or regulation or what would subject HSL or its affiliates to any registration or licensing requirement within such jurisdiction. If this report is inadvertently send or has reached any individual in such country, especially, USA, the same may be ignored and brought to the attention of the sender. This document may not be reproduced, distributed or published for any purposes without prior written approval of HSL. Foreign currencies denominated securities, wherever mentioned, are subject to exchange rate fluctuations, which could have an adverse effect on their value or price, or the income derived from them. In addition, investors in securities such as ADRs, the values of which are influenced by foreign currencies effectively assume currency risk. It should not be considered to be taken as an offer to sell or a solicitation to buy any security. HSL may from time to time solicit from, or perform broking, or other services for, any company mentioned in this mail and/or its attachments. HSL and its affiliated company(ies), their directors and employees may; (a) from time to time, have a long or short position in, and buy or sell the securities of the company(ies) mentioned herein or (b) be engaged in any other transaction involving such securities and earn brokerage or other compensation or act as a market maker in the financial instruments of the company(ies) discussed herein or act as an advisor or lender/borrower to such company(ies) or may have any other potential conflict of interests with respect to any recommendation and other related information and opinions. HSL, its directors, analysts or employees do not take any responsibility, financial or otherwise, of the losses or the damages sustained due to the investments made or any action taken on basis of this report, including but not restricted to, fluctuation in the prices of shares and bonds, changes in the currency rates, diminution in the NAVs, reduction in the dividend or income, etc. HSL and other group companies, its directors, associates, employees may have various positions in any of the stocks, securities and financial instruments dealt in the report, or may make sell or purchase or other deals in these securities from time to time or may deal in other securities of the companies / organizations described in this report. HSL or its associates might have managed or co-managed public offering of securities for the subject company or might have been mandated by the subject company for any other assignment in the past twelve months. HSL or its associates might have received any compensation from the companies mentioned in the report during the period preceding twelve months from t date of this report for services in respect of managing or co-managing public offerings, corporate finance, investment banking or merchant banking, brokerage services or other advisory service in a merger or specific transaction in the normal course of business. HSL or its analysts did not receive any compensation or other benefits from the companies mentioned in the report or third party in connection with preparation of the research report. Accordingly, neither HSL nor Research Analysts have any material conflict of interest at the time of publication of this report. Compensation of our Research Analysts is not based on any specific merchant banking, investment banking or brokerage service transactions. HSL may have issued other reports that are inconsistent with and reach different conclusion from the information presented in this report. Research entity has not been engaged in market making activity for the subject company. Research analyst has not served as an officer, director or employee of the subject company. We have not received any compensation/benefits from the subject company or third party in connection with the Research Report. HDFC securities Limited, I Think Techno Campus, Building - B, "Alpha", Office Floor 8, Near Kanjurmarg Station, Opp. Crompton Greaves, Kanjurmarg (East), Mumbai 400 042 Phone: (022) 3075 3400 Fax: (022) 2496 5066 Compliance Officer: Binkle R. Oza Email: complianceofficer@hdfcsec.com Phone: (022) 3045 3600 HDFC Securities Limited, SEBI Reg. No.: NSE-INB/F/E 231109431, BSE-INB/F 011109437, AMFI Reg. No. ARN: 13549, PFRDA Reg. No. POP: 04102015, IRDA Corporate Agent License No.: HDF 2806925/HDF C000222657, SEBI Research Analyst Reg. No.: INH000002475, CIN - U67120MH2000PLC152193 Mutual Funds Investments are subject to market risk. Please read the offer and scheme related documents carefully before investing. Page | 8
INSECTICIDES INDIA : RESULTS REVIEW 1QFY19 HDFC securities Institutional Equities Unit No. 1602, 16th Floor, Tower A, Peninsula Business Park, Senapati Bapat Marg, Lower Parel,Mumbai - 400 013 Board : +91-22-6171 7330www.hdfcsec.com Page | 9