Download
1 / 1
20 likes | 184 Views
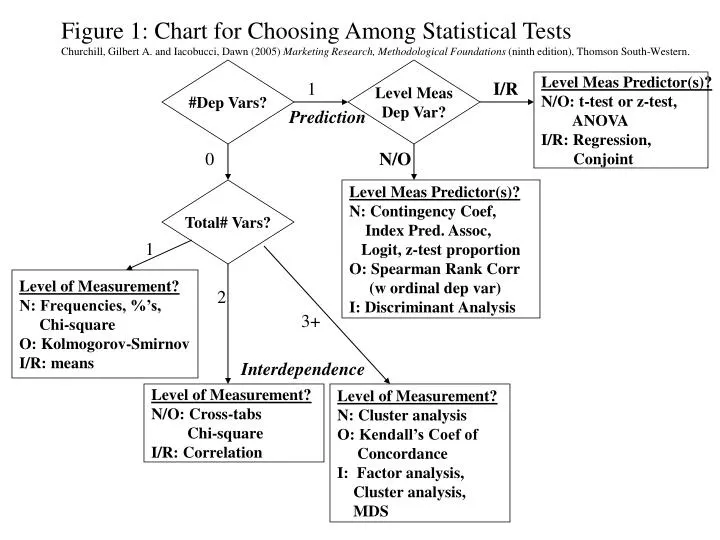
Figure 1: Chart for Choosing Among Statistical Tests Churchill, Gilbert A. and Iacobucci, Dawn (2005) Marketing Research, Methodological Foundations (ninth edition), Thomson South-Western. #Dep Vars?. Level Meas Dep Var?. Level Meas Predictor(s)? N/O: t-test or z-test, ANOVA

E N D
Figure 1: Chart for Choosing Among Statistical Tests Churchill, Gilbert A. and Iacobucci, Dawn (2005) Marketing Research, Methodological Foundations (ninth edition), Thomson South-Western. #Dep Vars? Level Meas Dep Var? Level Meas Predictor(s)? N/O: t-test or z-test, ANOVA I/R: Regression, Conjoint 1 I/R Prediction 0 N/O Total# Vars? Level Meas Predictor(s)? N: Contingency Coef, Index Pred. Assoc, Logit, z-test proportion O: Spearman Rank Corr (w ordinal dep var) I: Discriminant Analysis 1 Level of Measurement? N: Frequencies, %’s, Chi-square O: Kolmogorov-Smirnov I/R: means 2 3+ Interdependence Level of Measurement? N/O: Cross-tabs Chi-square I/R: Correlation Level of Measurement? N: Cluster analysis O: Kendall’s Coef of Concordance I: Factor analysis, Cluster analysis, MDS