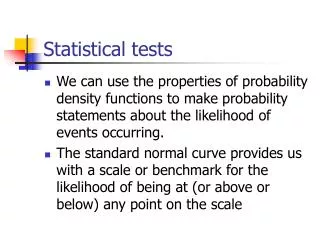
Download
1 / 100
1.01k likes | 1.26k Views
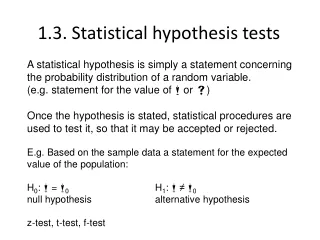
Statistical Tests for Computational Intelligence Research and Human Subjective Tests. Slides are at http://www.design.kyushu-u.ac.jp/~takagi/TAKAGI/StatisticalTests.html. Hideyuki TAKAGI Kyushu University, Japan http://www.design.kyushu-u.ac.jp/~takagi /. ver. July 15, 2013

E N D
Statistical Testsfor Computational Intelligence Research and Human Subjective Tests Slides are at http://www.design.kyushu-u.ac.jp/~takagi/TAKAGI/StatisticalTests.html Hideyuki TAKAGI Kyushu University, Japan http://www.design.kyushu-u.ac.jp/~takagi/ ver. July 15, 2013 ver. July 11, 2013 ver. April 23, 2013
Contents 2 groups n groups (n > 2) data distribution unpaired (independent) ・unpaired t-test ・ one-way ANOVA ANOVA (Analysis of Variance) Parametric Test (normality) paired (related) ・paired t-test ・ two-way ANOVA unpaired (independent) ・Mann-Whitney U-test one-way data ・Kruskal-Wallistest (no normality) Non-parametric Test ・sign test paired (related) two-way data ・Friedmantest ・Wilcoxon signed-ranks test + Scheffé's method of paired comparison for Human Subjective Tests
How to Show Significance? Just compare averages visually? It is not scientific. conventional EC conventional EC fitness fitness proposed EC2 proposed EC1 generations generations Fig. XX Average convergence curves of n times of trial runs.
How to Show Significance? Sound design concept: exiting sound made by conventional IEC sound made by proposed IEC1 sound made by proposed IEC2 Which method is good to make exiting sound? How to show it?
You cannot show the superiority of your method without statistical tests. Papers without statistics tests may be rejected. My method is significantly better! statistical test
Which Test Should We Use? 2 groups n groups (n > 2) data distribution unpaired (independent) ・unpaired t-test ・ one-way ANOVA ANOVA (Analysis of Variance) Parametric Test (normality) paired (related) ・paired t-test ・ two-way ANOVA unpaired (independent) ・Mann-Whitney U-test one-way data ・Kruskal-Wallistest (no normality) Non-parametric Test ・sign test paired (related) two-way data ・Friedmantest ・Wilcoxon signed-ranks test
Which Test Should We Use? 2 groups n groups (n > 2) data distribution unpaired (independent) ・unpaired t-test ・ one-way ANOVA ANOVA (Analysis of Variance) Parametric Test (normality) paired (related) ・paired t-test ・ two-way ANOVA unpaired (independent) ・Mann-Whitney U-test one-way data ・Kruskal-Wallistest n-th generation n-th generation (no normality) Non-parametric Test ・sign test paired (related) two-way data ・Friedmantest ・Wilcoxon signed-ranks test
Which Test Should we Use? 2 groups n groups (n > 2) data distribution unpaired (independent) ・unpaired t-test ・ one-way ANOVA Normality Test ANOVA (Analysis of Variance) Parametric Test (normality) • Anderson-Darling test • D'Agostino-Pearson test • Kolmogorov-Smirnov test • Shapiro-Wilk test • Jarque–Bera test • ・・・・ paired (related) ・paired t-test ・ two-way ANOVA unpaired (independent) ・Mann-Whitney U-test one-way data ・Kruskal-Wallistest (no normality) Non-parametric Test Find a free Excel add-in or software. ・sign test paired (related) two-way data ・Friedmantest ・Wilcoxon signed-ranks test
Which Test Should We Use? 2 groups n groups (n > 2) data distribution unpaired (independent) unpaired data (independent) paired data (related) ・unpaired t-test ・ one-way ANOVA ANOVA (Analysis of Variance) Parametric Test (normality) paired (related) ・paired t-test ・ two-way ANOVA unpaired (independent) ・Mann-Whitney U-test one-way data ・Kruskal-Wallistest (no normality) Non-parametric Test ・sign test paired (related) two-way data ・Friedmantest ・Wilcoxon signed-ranks test
Which Test Should We Use? 2 groups n groups (n > 2) data distribution unpaired (independent) unpaired data (independent) paired data (related) ・unpaired t-test ・ one-way ANOVA ANOVA (Analysis of Variance) Parametric Test (normality) paired (related) ・paired t-test ・ two-way ANOVA unpaired (independent) ・Mann-Whitney U-test one-way data ・Kruskal-Wallistest (no normality) Non-parametric Test ・sign test paired (related) two-way data ・Friedmantest ・Wilcoxon signed-ranks test
Which Test Should We Use? Q1: Which tests are more sensitive, those for unpaired data or paired data? 2 groups n groups (n > 2) data distribution A1: Statistical tests for paired data because of more data information. unpaired (independent) unpaired data (independent) paired data (related) ・unpaired t-test ・ one-way ANOVA ANOVA (Analysis of Variance) Parametric Test (normality) paired (related) ・paired t-test ・ two-way ANOVA unpaired (independent) ・Mann-Whitney U-test one-way data ・Kruskal-Wallistest (no normality) Non-parametric Test ・sign test paired (related) two-way data ・Friedmantest ・Wilcoxon signed-ranks test
Which Test Should We Use? Q2: How should you design your experimental conditions to use statistical tests for paired dataand reduce the # of trial runs? 2 groups n groups (n > 2) data distribution A2: Use the same initialized data for the set of (method A, method B) at each trial run. unpaired (independent) ・unpaired t-test ・ one-way ANOVA ANOVA (Analysis of Variance) Parametric Test (normality) paired (related) ・paired t-test ・ two-way ANOVA significant? unpaired (independent) ・Mann-Whitney U-test one-way data ・Kruskal-Wallistest (no normality) Non-parametric Test ・sign test paired (related) two-way data ・Friedmantest ・Wilcoxon signed-ranks test n-th generation
Which Test Should we Use? Q3: Which statistical tests are sensitive, parametric tests or non-parametric ones and why? 2 groups n groups (n > 2) data distribution A3: Parametric tests which can use information of assumed data distribution. unpaired (independent) ・unpaired t-test ・ one-way ANOVA ANOVA (Analysis of Variance) Parametric Test (normality) paired (related) ・paired t-test ・ two-way ANOVA unpaired (independent) ・Mann-Whitney U-test one-way data ・Kruskal-Wallistest (no normality) Non-parametric Test ・sign test paired (related) two-way data ・Friedmantest ・Wilcoxon signed-ranks test
t-Test 2 groups n groups (n > 2) data distribution unpaired (independent) ・unpaired t-test ・ one-way ANOVA ANOVA (Analysis of Variance) t-test Parametric Test (normality) paired (related) ・paired t-test ・ two-way ANOVA unpaired (independent) ・Mann-Whitney U-test one-way data ・Kruskal-Wallistest (no normality) Non-parametric Test ・sign test paired (related) two-way data ・Friedmantest ・Wilcoxon signed-ranks test
t-Test How to Show Significance? significant? n-th generation
t-Test Test this difference with assuming no difference.(null hypothesis) significant difference? Conditions to use t-tests: normality equal variances
t-Test F-Test Test this difference with assuming no difference.(null hypothesis) Normality Test • Anderson-Darling test • D'Agostino-Pearson test • Kolmogorov-Smirnov test • Shapiro-Wilk test • Jarque–Bera test • ・・・・ significant difference? When (p > 0.05), we assume that there is no significant difference between σ2A and σ2B . Conditions to use t-tests: normality equal variances
t-Test Excel (32 bits version only?) has t-testsand ANOVA in Data Analysis Tools. You must install its add-in. (File -> option -> add-in, and set its add-in.)
t-Test (1) t-Test: Pairs two sample for means This is a case when each pair of two methods with the same initial condition. significant? n-th generation (3) t-Test: Two-sample assuming unequal variances: Welch's t-test (2) t-Test: Two-sample assuming equal variances
t-Test t-Test: Paired Two Sample for Means sample data
t-Test t-Test: Paired Two Sample for Means sample data When p-value is less than 0.01 or 0.05, we assume that there is significant difference with the level of significance of (p < 0.01) or (p < 0.05). 2.5% 2.5% 5% A ≈B A < B A > B When A>B never happens, you may use a one-tail test.
t-Test (2) t-Test: Two-sample assuming equal variances (1) t-Test: Pairs two sample for means Difference between two groups is significant (p < 0.01). We cannot say that there is a significant difference between two group.
ANOVA: Analysis of Variance 2 groups n groups (n > 2) data distribution unpaired (independent) ・unpaired t-test ・ one-way ANOVA ANOVA (Analysis of Variance) ANOVA Parametric Test (normality) paired (related) ・paired t-test ・ two-way ANOVA unpaired (independent) ・Mann-Whitney U-test one-way data ・Kruskal-Wallistest (no normality) Non-parametric Test ・sign test paired (related) two-way data ・Friedmantest ・Wilcoxon signed-ranks test
ANOVA: Analysis of Variance If data have normality equal variances significant? n-th generation
ANOVA: Analysis of Variance 1. Analysis of more than two data groups. 2. Normality and equal variance are required. Excel has ANOVA in Data Analysis Tools. C A B
ANOVA: Analysis of Variance 1. Analysis of more than two data groups. 2. Normality and equal variance are required. Excel has ANOVA in Data Analysis Tools. Check it using the Bartlett test. C A B = three t-tests one ANOVA Three times of t-test with (p<0.05) equivalent one ANOVA (p<0.14). 1-(1-0.05)3 = 0.14
ANOVA: Analysis of Variance When data are independent, use one-way ANOVA (single factor ANOVA). When data correspond each other, use two-way ANOVA (two-factor ANOVA). n-th generation
ANOVA: Analysis of Variance Q1: What are "single factor" and "two factors"? A1: A column factor (e.g. three groups) and a sample factor (e.g. initialized condition). When data are independent, use one-way ANOVA (single factor ANOVA). When data correspond each other, use two-way ANOVA (two-factor ANOVA). column factor column factor sample factor
ANOVA: Analysis of Variance one-factor (one-way) ANOVA two-factor (two-way) ANOVA column factor column factor We cannot say that three groups are significantly different. (p=0.089) There are significant difference somewhere among three groups. (p<0.05) sample factor
ANOVA: Analysis of Variance Output of the one-way ANOVA When (p-value < 0.01 or 0.05), there is(are) significant difference somewhere among data groups. Column factor Output of the two-way ANOVA Sample factor • Significant difference among Sample (e.g. initial conditions) cannot be found (p > 0.05). • Significant difference can be found somewhere among Columns (e.g. three methods) (p < 0.01). • We need not care an interaction effect between two factors (e.g. initial condition vs. methods) (p > 0.05).
ANOVA: Analysis of Variance Q1: Where is significant among A, B, and C? A1: Apply multiple comparisons between all pairs among columns. (Fisher's PLSD method, Scheffé method, Bonferroni-Dunn test, Dunnett method, Williams method, Tukey method, Nemenyi test, Tukey-Kramer method, Games/Howell method, Duncan's new multiple range test, Student-Newman-Keuls method, etc. Each has different characteristics.) Column factor Sample factor significant?
Non-Parametric Tests 2 groups n groups (n > 2) data distribution unpaired (independent) ・unpaired t-test ・ one-way ANOVA If normality and equal variances are not guaranteed, use non-parametric tests. ANOVA (Analysis of Variance) Parametric Test (normality) paired (related) ・paired t-test ・ two-way ANOVA unpaired (independent) ・Mann-Whitney U-test one-way data ・Kruskal-Wallistest (no normality) Non-parametric Test ・sign test paired (related) two-way data ・Friedmantest ・Wilcoxon signed-ranks test
Mann-Whitney U-test 2 groups n groups (n > 2) data distribution unpaired (independent) ・unpaired t-test ・ one-way ANOVA ANOVA (Analysis of Variance) Parametric Test (normality) paired (related) ・paired t-test ・ two-way ANOVA unpaired (independent) ・Mann-Whitney U-test one-way data ・Kruskal-Wallistest (no normality) Non-parametric Test ・sign test paired (related) two-way data ・Friedmantest ・Wilcoxon signed-ranks test
Mann-Whitney U-test (Wilcoxon-Mann-Whitney test, two sample Wilcoxon test) Comparison of two groups. Data have no normality. There are no data corresponding between two groups (independent). ? no normality ? n-th generation
Mann-Whitney U-test (Wilcoxon-Mann-Whitney test, two sample Wilcoxon test) 1. Calculate a U value. 0 2 3 4 ) ( when two values are the same, count as 0.5. U = 0 + 2 + 3 + 4 = 9U' = 11 (U + U' = n1n2)
Mann-Whitney U-test (cont.) (Wilcoxon-Mann-Whitney test, two sample Wilcoxon test) 2. See a U-test table. • Use the smaller value of U or U'. • When n1 ≤ 20 and n2≤ 20 , see a Mann-Whitney test table.(where n1 and n2 are the # of data of two groups.) • Otherwise, since U follows the below normal distribution roughly, • normalize U as and check a standard normal distribution table • with the , where and .
Examples: Mann-Whitney U-test (Wilcoxon-Mann-Whitney test, two sample Wilcoxon test) Ex.1 Ex.2 Ex.3 0 0 3.5 0.5 2 5 2.5 5 3 4 5 4 5 5 (p > 0.05) U = 9 U' = 11 U = 12 U' = 13 U = 23.5 U' = 1.5 (p > 0.05) (p > 0.05) significant (p < 0.05) (p < 0.05) (p < 0.01) n2 n2 n1 n1
Exercise: Mann-Whitney U-test (Wilcoxon-Mann-Whitney test, two sample Wilcoxon test) 2.5 4 5 6 6 6 U = 29.5 U' = 6.5 ) ( Since U' > 5, (p > 0.05): significance is not found (p < 0.05) (p < 0.01) n2 n2 n1 n1
Sign Test 2 groups n groups (n > 2) data distribution unpaired (independent) ・unpaired t-test ・ one-way ANOVA ANOVA (Analysis of Variance) Parametric Test (normality) paired (related) ・paired t-test ・ two-way ANOVA unpaired (independent) ・Mann-Whitney U-test one-way data ・Kruskal-Wallistest (no normality) Non-parametric Test ・sign test paired (related) two-way data ・Friedmantest ・Wilcoxon signed-ranks test
Sign Test (1)Sign Test significance test between the # of winnings and losses (2)Wilcoxon's Signed Ranks Test significance test using both the # of winnings and losses and the level of winnings/losses data of 2 groups # of winnings and losses the level of winnings/losses
Sign Test Calculate the # of winnings and losses by comparing runs with the same initial data. Check a sign test table to show significance of two methods. n-th generation
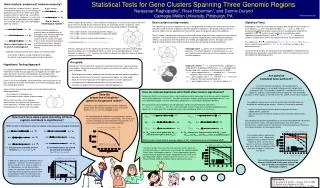
Sign Test Fig.3 in Y. Pei and H. Takagi, "Fourier analysis of the fitness landscape for evolutionary search acceleration," IEEE Congress on Evolutionary Computation (CEC), pp.1-7, Brisbane, Australia (June 10-15, 2012). The (+,-) marks show whether our proposed methods converge significantly better or poorer than normal DE, respectively, (p ≤0.05). Fig.2 in the same paper.
level of significance level of significance Sign Test % % % % Task Example Whether performances of pattern recognition methods A and B are significantly different? n1 cases: Both methods succeeded. n2 cases: Method A succeeded, and method B failed. n3 cases: Method A failed, and method B succeeded. n4 cases: Both methods failed. How to check? • Set N = n2 + n3. • Check the right table with the N. • If min(n2, n3) is smaller than the number for the N, we can say that there is significant difference with the significant risk level of XX. Exercise Whether there is significant difference for n2= 12 and n3 = 28? ANSWER: Check the right table with N = 40. As n2 is bigger than 11 and smaller than 13, we can say that there is a significant difference between two with (p < 0.05) but cannot say so with (p < 0.01).
Sign Test level of significance % % Let's think about the case of N = 17. To say that n1 and n2 are significantly different, (n1 vs. n2) = (17 vs. 0), (16 vs. 1), or (15 vs. 2) (p < 0.01) or (n1 vs. n2) = (14 vs. 3) or (13 vs. 4) (p < 0.05)
Exercise: Sign Test level of significance % % Check the significance of: 16 vs. 4 14 vs. 1 9 vs. 3 18 vs. 5
Wilcoxon Signed-Ranks Test 2 groups n groups (n > 2) data distribution unpaired (independent) ・unpaired t-test ・ one-way ANOVA ANOVA (Analysis of Variance) Parametric Test (normality) paired (related) ・paired t-test ・ two-way ANOVA unpaired (independent) ・Mann-Whitney U-test one-way data ・Kruskal-Wallistest (no normality) Non-parametric Test ・sign test paired (related) two-way data ・Friedmantest ・Wilcoxon signed-ranks test
Wilcoxon Signed-Ranks Test Q: When a sign test could not show significance, how to do? A: Try the Wilcoxon signed-ranks test. It is more sensitive than a simple sign test due to more information use. n-th generation
Wilcoxon Signed-Ranks Test (1)Sign Test significance test between the # of winnings and losses (2)Wilcoxon's Signed Ranks Test significance test using both the # of winnings and losses and the level of winnings/losses data of 2 groups # of winnings and losses the level of winnings/losses
Wilcoxon Signed-Ranks Test Example: (step 1) (step 4) (step 2) (step 3) (step 5) (step 6) Wilcoxon test table
Wilcoxon Test Table: significance point of T (step 6) n = 8 T = 3 T=3 ≤ 3 (n=8, p<0.05), then difference between systems A and B is significant. T=3 > 0 (n=8, p<0.01), then we cannot say there is a significant difference. When n > 25 As T follows the below normal distribution roughly, normalize T as the below and check a standard normal distribution table with the z; see and in the above equation.