Download
1 / 12
120 likes | 204 Views
DOECGF 2011: LLNL Site Report Integrated Computing & Communications Department Livermore Computing Information Management & Graphics Richard Cook. April 26, 2011 Page. DOECGF11. Where is Graphics Expertise at LLNL?.

E N D
DOECGF 2011: LLNL Site ReportIntegrated Computing & Communications Department Livermore Computing Information Management & GraphicsRichard Cook April 26, 2011 Page DOECGF11
Where is Graphics Expertise at LLNL? • At the High-Performance Computing Center in the Information Management and Graphics (IMG) Group • In the Applications, Simulations, and Quality Division, in the Data Group (under Eric Brugger) • At the Center for Applied Scientific Computing in the Data Analysis Group (under Daniel Laney) April 26, 2011 Page DOECGF11
Who are our users and what are their requirements? • Who? • Physicists, chemists, biologists • Computer scientists • HPC users – novice to expert • Major science applications • ALE3d, ddcMD, pf3d, Miranda, CPMD, • Qbox, MDCask, ParaDiS, climate, bio, … • What? • Need to analyze data, often interactively. • Need to visualize data for scientific insight, publication, and presentation, sometimes collaborating with vis specialists. • Need to interact with all or part of the data. For the largest data sets, zero-copy access is a must and data management is key. April 26, 2011 Page DOECGF11
Information Management & Graphics Group Develops and supports tools for managing, visualizing, analyzing, and presenting scientific data Data exploration of distributed, complex, unique data sets Multi-TB datasets with 10s of billions of zones 1000s of files/timestep and 100s of timesteps Using vis servers with high I/O rates Graphics consulting and video production Presentation support for PowerWalls Visualization hardware procurement and support Data management with Hopper file manager April 26, 2011 Page DOECGF11
LC Graphics Consulting • Support and maintain graphics packages • Tools and Libraries: VisIt, EnSight, AVS/Express, Tecplot... • Everyday Utilities: ImageMagick, xv, xmgrace, gnuplot… • Custom development and consulting • Custom scripts and compiled code to automate tool use • Data conversion • Tool support in parallel environments April 26, 2011 Page DOECGF11
Visualization Theater Software Development • Blockbuster Movie Player • Distributed parallel design with streaming I/O system • Effective cache and I/O utilization for high frame rates • Sidecar provides “movie cues” and remote control • Cross platform (Linux, Windows*, Mac OS) -- works on vis clusters and desktops with same copy of movie • Technologies: C++, Qt, OpenGL, MPI, pthreads • Blockbuster is open source: http://www.sourceforge.net/projects/blockbuster • Telepath Session Manager • Simple interface to hide the complexity of the environment that includes vis servers, displays, switches, and software application layers including resource managers, xservers • Orchestrates vis sessions: allocates nodes, configures services, sets up environments, and manages session • Technologies: Python, Tkinter. • Interface to DMX -- Distributed Multihead X (X Server of Servers) and SLURM April 26, 2011 Page DOECGF11
Visualization Hardware Usage Model • When possible or necessary users run vis tools on HPC platforms where data was generated and use “vis nodes”. • When advantageous or necessary, users run vis tools on interactive vis servers that share a file system with the compute platforms. • Small display clusters drive PowerWalls, removing the need for large vis servers to drive displays. • Some applications require graphics cards in vis servers; others benefit from high bandwidth to file system and large memory footprint without need for graphics cards. Vis cluster (typically fraction of size of other clusters) See next slide for LC description DOE Computer Graphics Forum 7
Current LLNL Visualization Hardware NAS NAS TSF PowerWall TSF PowerWall 451 PowerWall Lustre Edge PW 2 Lustre PW 1 Graph • Two large servers, several small display clusters, all running Linux with same admin support as compute clusters. Four machine rooms. • Users access clusters over the network using diskless workstations on SCF and various workstations on the OCF. No RGB to offices. Secure Computing Facility Open Computing Facility Moebius Grant Stagg Thriller April 26, 2011 Page DOECGF11 Boole
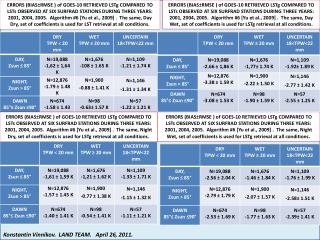
Specs for two production vis servers and five wall drivers PowerWall clusters are 6-10 nodes and all have Opteron CPUs with IB interconnect, with Quadro FX5600 for walls with stereo and FX 4600s for the two without stereo. The newest have 8 GB RAM per node and older have 4 GB RAM. April 26, 2011 Page DOECGF11
HPC at LLNL - Livermore Computing • Production vis systems: Edge and Graph April 26, 2011 Page DOECGF11
Our petascale driver - Sequoia • We have a multi-PetaFlop machine arriving going into production in 2012 • Furthers our ability to simulate complex phenomena “just like God does it – one atom at a time” • Uncertainty quantification • 3D confirmations of 2D discoveries for more predictive models • The success of Sequoia will depend on an enormous off-machine petascale storage infrastructure April 26, 2011 Page DOECGF11
More Information/Contacts • General LLNL Computing Information • http://computing.llnl.gov • DNT - B Division’s Data and Vis Group • Eric Brugger: brugger1@llnl.gov • Information Management and Graphics Group • Becky Springmeyer: springme@llnl.gov • Rich Cook: rcook@llnl.gov • https://computing.llnl.gov/vis • CASC Data Analysis Group • Daniel Laney: laney1@llnl.gov • https://computation.llnl.gov/casc/ • Scientific Data Management Project • Jeff Long: jwlong@llnl.gov • https://computing.llnl.gov/resources/hopper/ April 26, 2011 Page DOECGF11