Download
1 / 112
1.12k likes | 1.29k Views
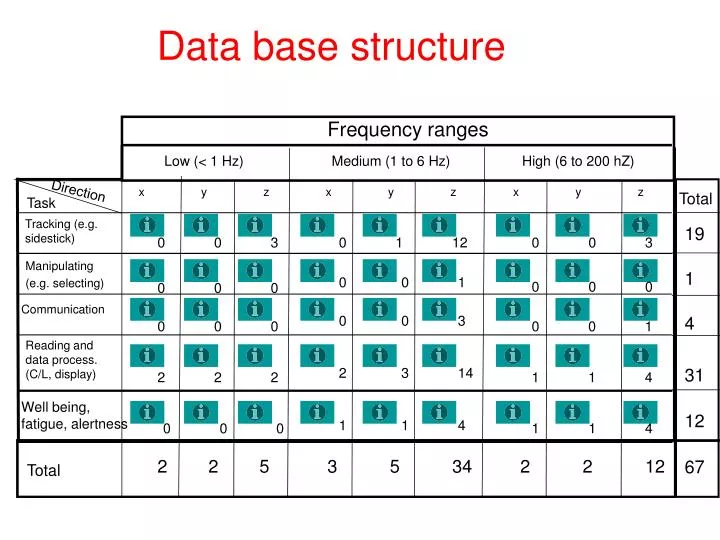
Data base structure. Frequency ranges. Low ( < 1 Hz ). Medium (1 to 6 Hz). High (6 to 200 hZ). x. y. z. x. y. z. x. y. z. Direction. Total . Task. Tracking (e.g. sidestick). 19. 0. 0. 3. 0. 1. 12. 0. 0. 3. Manipulating (e.g. selecting). 1. 0. 0. 1. 0. 0. 0. 0.

E N D
Data base structure Frequency ranges Low (< 1 Hz) Medium (1 to 6 Hz) High (6 to 200 hZ) x y z x y z x y z Direction Total Task Tracking (e.g. sidestick) 19 0 0 3 0 1 12 0 0 3 Manipulating (e.g. selecting) 1 0 0 1 0 0 0 0 0 0 Communication 0 0 3 4 0 0 0 0 0 1 Reading and data process. (C/L, display) 31 2 3 14 2 2 2 1 1 4 Well being, fatigue, alertness 12 1 1 4 0 0 0 1 1 4 2 2 5 3 5 34 2 2 12 67 Total
2 • Frequency : Low • Axis : x • Task or measure : tracking
3 • Frequency : Low • Axis : y • Task or measure : tracking
4 • Frequency : Low • Axis : z • Task or measure : tracking
Effects of Low Frequency Whole-Body Vibration on Tracking Performance Physical description of the stressor (frequency, direction, magnitude, duration, regularity, crest) Threshold of acceptability Effects of exposure duration Conditions : lab, field study (aviation or other) Sample sizes and characterization : type (pilot or other), experience, gender, age, body measures Task/activities description : input details (display size, position), performance measures, training Human performance: tracking task Comments Ref. 23 Frequency: ø 0.15 Hz Magnitude: 0.151-0.271 rms ms-2 pseudo random Axis : z Input: by a seat six experiment. blocks: control run, five vibration conditions (three levels of whole-body random vibration, two lowest vibration levels+randomly occuring impacts) in randomised order --- --- Lab (z-axis vibrator) 12 male subjects 10 army officers, 2 civilians experienced with vibration experiments For the random vibration inputs the mean absolute tracking error increases significantly linearly with rms acceleration. The additional error due to the impacts increases in proportion to the peak acceleration raised to the power 2.5. References: Hall, L. C. The effect of low frequency whole body vibration and impacts on human tracking performance. Journal of Low Frequency Noise & Vibration, 4(4), 1985, pp. 154-162. Return to main table Other ref.
Effects of Display Collimation and Vibration Waveform at Frequencies From 0.5 to 10 Hz on Manual Control Performance Physical description of the stressor (frequency, direction, magnitude, duration, regularity, crest) Threshold of acceptability Effects of exposure duration Conditions : lab, field study (aviation or other) Sample sizes and characterization : type (pilot or other), experience, gender, age, body measures Task/activities description : input details (display size, position), performance measures, training Human performance: combined continuous tracking and discrete target acquisition task (two axis pursuit tracking with simplified version of aircrafts dynamics plus button pressing to indicate when on target) Comments Ref. 46 Frequency: 0.5 Hz sinusoidal Magnitude: 1.6 rms ms-2 0.5-10.0 Hz 1/3 octave band random 2.1 rms ms-2 Axis : z Input: by a seat two exp. sessions: 1. sinusoidal, 2. 1/3 octave band random, randomised order in each group, 1 min. warming-up, 16 runs à 150 sec --- --- Lab (electro-hydraulic vibrator) 16 male subjects 18-32 years two independent groups of 8 subjects each (collimination and no collimintaion) Without display collimination both types of vibration significantly disrupt performance at all frequencies. Colliminating the display removes the disruption at frequencies above 1.6 Hz. With random vibration collimination also reduces the effect of vibration at frequencies below 1.6 Hz. Differences between the effects of sinusoidal and random vibration occur only with vibration of 2.0-2.5 Hz. When a operator is required to perform continuous manual control during low frequency vibration exposure, performance impairments due to vibration may be reduced by colliminating relevant displays. References: McLeod, R.W. & Griffin, M.J. Effects of whole-body vibration waveform and display collimation on the performance of a complex manual control task. Aviation, Space and Environmental Medicine, 61, 1990, pp. 211-219. Return to main table Other ref.
Effects of Vibration Frequency from 0.5 to 5.0 Hz on Manual Control Performance Physical description of the stressor (frequency, direction, magnitude, duration, regularity, crest) Threshold of acceptability Effects of exposure duration Conditions : lab, field study (aviation or other) Sample sizes and characterization : type (pilot or other), experience, gender, age, body measures Task/activities description : input details (display size, position), performance measures, training Human performance: combined continuous and discrete pursuit tracking task; Subjects are highly trained (at least 10 practice sessions à 3-min.). Comments Ref. 24 Frequency: 0.5-5.0 Hz Magnitude: 2.0 rms ms- Axis : z (sinusoidal) Input: by a seat two experimental sessions á 13 3-min. runs each: one warming up, one without, 11 with vibration, randomised orders --- --- Lab (electro-hydraulic vibrator) 8 male subjects 22-28 years Disruption of continuous performance is approximately constant at about 5% from 0.5 to 3.15 Hz and increases from 4.0 Hz up to 15% at 5 Hz. A visual mechanism is assumed to account for the increased disruption at higher frequencies. The vibration effect on discrete task is not disrupted by the frequency independently from the effects on the continuous task. References: McLeod, R.W. & Griffin, M.J. Performance of a complex manual control task during exposure to whole-body vertical vibration between 0.5 and 5.0 Hz. Ergonomics, 31, 1988, pp. 1193-1203. Return to main table Other ref.
5 • Frequency : Low • Axis : x • Task or measure : manipulating
6 • Frequency : Low • Axis : y • Task or measure : manipulating
7 • Frequency : Low • Axis : z • Task or measure : manipulating
8 • Frequency : Low • Axis : x • Task or measure : communication
9 • Frequency : Low • Axis : y • Task or measure : communication
10 • Frequency : Low • Axis : z • Task or measure : communication
11 • Frequency : Low • Axis : x • Task or measure : reading and data process
Effects of horizontal low frequency vibration on reading Physical description of the stressor (frequency, direction, magnitude, duration, regularity, crest) Threshold of acceptability Effects of exposure duration Conditions : lab, field study (aviation or other) Sample sizes and characterization : type (pilot or other), experience, gender, age, body measures Task or measure/activities description : input details (display size, position), performance measures, training Comments Ref. 7 Frequency: 0 - 1 Hz Magnitude : 2 - 5 m/s2 Axis : x (pitching) Rotation : +/- 30° y (twisting) Translation : +/- 10 cm z (rolling) Input: by a chair Disruptive effects (increase of reading time) appear from the beginning of the movement and increase with frequency. Lab for aviation study Pilots Alpha numeric characters reading Task or measures Pitching and twisting are more disruptive movements than rolling (reading time increase of 60%) Twisting and pitching are more disruptive movements than rolling (reading time increase of 60%) Rolling is less disruptive movements than twisting and pitching (reading time increase of 27%) MALVACHE (M.).: Les laboratoires français effectuant des études de vibrations en relation avec l’être humain: le Laboratoire d’automatique indus. et hum. de l’Univ. de Valenciennes. In: Les vibrations industrielles. Doc INRS. Mars 1983. Pp 135-136. References: Return to main table Other ref.
Effects of horizontal low and medium frequency vibration on reading Physical description of the stressor (frequency, direction, magnitude, duration, regularity, crest) Threshold of acceptability Effects of exposure duration Conditions : lab, field study (aviation or other) Sample sizes and characterization : type (pilot or other), experience, gender, age, body measures Task or measure/activities description : input details (display size, position), performance measures, training Comments Ref. 3 Frequency: 0.5 - 10 Hz Random Axis : x and y Magnitude : 1.0 and 1.25 m/s2 Input: by a chair with backrest attached to vibration table Horizontal vibration of seated subjects cause a maximum measured reduction in the speed of reading at 4 Hz, to a lesser extent at 3.15 Hz and 5 Hz. Lab 16 subjects (8 male, 8 female), aged from 19 to 30 years Reading of 68 sheets of paper containing a photocopy of the first leader article in an edition of the london Times. Reading speed is calculated from the number of syllables read in a 30s period. Horizontal medium frequency vibration have a more important effect on reading speed than lateral medium frequency vibration (probably because of transmission of vibrations by backrest seat). References: GRIFFIN (M.J.); HAYWARD (R.A.): Effects of horizontal whole-body vibration on reading. In: Applied Ergonomics, 1994, Vol 25, n°3, pp. 165-169. Return to main table Other ref.
12 • Frequency : Low • Axis : y • Task or measure : reading and data process
Effects of horizontal low frequency vibration on reading Physical description of the stressor (frequency, direction, magnitude, duration, regularity, crest) Threshold of acceptability Effects of exposure duration Conditions : lab, field study (aviation or other) Sample sizes and characterization : type (pilot or other), experience, gender, age, body measures Task or measure/activities description : input details (display size, position), performance measures, training Comments Ref. 7 Frequency: 0 - 1 Hz Magnitude : 2 - 5 m/s2 Axis : x (pitching) Rotation : +/- 30° y (twisting) Translation : +/- 10 cm z (rolling) Input: by a chair Disruptive effects (increase of reading time) appear from the beginning of the movement and increase with frequency. Lab for aviation study Pilots Alpha numeric characters reading Task or measures Pitching and twisting are more disruptive movements than rolling (reading time increase of 60%) Twisting and pitching are more disruptive movements than rolling (reading time increase of 60%) Rolling is less disruptive movements than twisting and pitching (reading time increase of 27%) MALVACHE (M.).: Les laboratoires français effectuant des études de vibrations en relation avec l’être humain: le Laboratoire d’automatique indus. et hum. de l’Univ. de Valenciennes. In: Les vibrations industrielles. Doc INRS. Mars 1983. Pp 135-136. References: Return to main table Other ref.
Effects of horizontal low and medium frequency vibration on reading Physical description of the stressor (frequency, direction, magnitude, duration, regularity, crest) Threshold of acceptability Effects of exposure duration Conditions : lab, field study (aviation or other) Sample sizes and characterization : type (pilot or other), experience, gender, age, body measures Task or measure/activities description : input details (display size, position), performance measures, training Comments Ref. 3 Frequency: 0.5 - 10 Hz Random Axis : x and y Magnitude : 1.0 and 1.25 m/s2 Input: by a chair with backrest attached to vibration table Horizontal vibration of seated subjects cause a maximum measured reduction in the speed of reading at 4 Hz, to a lesser extent at 3.15 Hz and 5 Hz. Lab 16 subjects (8 male, 8 female), aged from 19 to 30 years Reading of 68 sheets of paper containing a photocopy of the first leader article in an edition of the london Times. Reading speed is calculated from the number of syllables read in a 30s period. Horizontal medium frequency vibration have a more important effect on reading speed than lateral medium frequency vibration (probably because of transmission of vibrations by backrest seat). References: GRIFFIN (M.J.); HAYWARD (R.A.): Effects of horizontal whole-body vibration on reading. In: Applied Ergonomics, 1994, Vol 25, n°3, pp. 165-169. Return to main table Other ref.
13 • Frequency : Low • Axis : z • Task or measure : reading and data process
Effects of horizontal low frequency vibration on reading Physical description of the stressor (frequency, direction, magnitude, duration, regularity, crest) Threshold of acceptability Effects of exposure duration Conditions : lab, field study (aviation or other) Sample sizes and characterization : type (pilot or other), experience, gender, age, body measures Task or measure/activities description : input details (display size, position), performance measures, training Comments Ref. 7 Frequency: 0 - 1 Hz Magnitude : 2 - 5 m/s2 Axis : x (pitching) Rotation : +/- 30° y (twisting) Translation : +/- 10 cm z (rolling) Input: by a chair Disruptive effects (increase of reading time) appear from the beginning of the movement and increase with frequency. Lab for aviation study Pilots Alpha numeric characters reading Task or measures Pitching and twisting are more disruptive movements than rolling (reading time increase of 60%) Twisting and pitching are more disruptive movements than rolling (reading time increase of 60%) Rolling is less disruptive movements than twisting and pitching (reading time increase of 27%) MALVACHE (M.).: Les laboratoires français effectuant des études de vibrations en relation avec l’être humain: le Laboratoire d’automatique indus. et hum. de l’Univ. de Valenciennes. In: Les vibrations industrielles. Doc INRS. Mars 1983. Pp 135-136. References: Return to main table Other ref.
Comparison of Display, Whole-Body and Simultaneous Whole-Body-and-Display Vibration on Reading Performance Physical description of the stressor (frequency, direction, magnitude, duration, regularity, crest) Threshold of acceptability Effects of exposure duration Conditions : lab, field study (aviation or other) Sample sizes and characterization : type (pilot or other), experience, gender, age, body measures Task/activities description : input details (display size, position), performance measures, training Human performance: numeral reading of a CRT display (characters subtend 5 min arc and 12 min arc at 0.75 m) Comments Ref. 27 Frequency: 0.5-5.0 Hz Magnitude: 1.0-2.5 rms ms-2 Axis : z (sinusoidal) Input: by a seat experimental conditions: 11 frequencies at 5 magnitudes (55 stimuli), three blocks: 1. display, 2. subject, 3. subject+display vibrating, randomised order --- --- Lab (hydraulic vibrator) 15 male subjects all under 30 years For frequencies below 4 Hz display vibration produces the largest performance decrements and whole-body-and-display vibration the least. Whole-body vibration with a stationary display produces significantly worse performance than simultaneous vibration of both observer and display but significantly better performance than display vibration alone. The variations in performance with frequency and viewing condition are consitent across all vibration magnitudes. References: Moseley, M.J. & Griffin, M.J. Effects of display vibration and whole-body vibration on visual performance. Ergonomics, 29, 1986, pp. 977-983. Return to main table Other ref.
Comparison of Display, Whole-Body and Simultaneous Whole-Body-and-Display Vibration on Reading Performance Physical description of the stressor (frequency, direction, magnitude, duration, regularity, crest) Threshold of acceptability Effects of exposure duration Conditions : lab, field study (aviation or other) Sample sizes and characterization : type (pilot or other), experience, gender, age, body measures Task/activities description : input details (display size, position), performance measures, training Human performance: numeral reading of a CRT display (characters subtend 5 min arc and 12 min arc at 0.75 m) Comments Ref. 27 Frequency: 0.5-5.0 Hz Magnitude: 1.0-2.5 rms ms-2 Axis : z (sinusoidal) Input: by a seat experimental conditions: 11 frequencies at 5 magnitudes (55 stimuli), three blocks: 1. display, 2. subject, 3. subject+display vibrating, randomised order --- --- Lab (hydraulic vibrator) 15 male subjects all under 30 years For frequencies below 4 Hz display vibration produces the largest performance decrements and whole-body-and-display vibration the least. Whole-body vibration with a stationary display produces significantly worse performance than simultaneous vibration of both observer and display but significantly better performance than display vibration alone. The variations in performance with frequency and viewing condition are consitent across all vibration magnitudes. References: Moseley, M.J. & Griffin, M.J. Effects of display vibration and whole-body vibration on visual performance. Ergonomics, 29, 1986, pp. 977-983. Return to main table Other ref.
14 • Frequency : Low • Axis : x • Task or measure : well being, fatigue, alertness
15 • Frequency : Low • Axis : y • Task or measure : well being, fatigue, alertness
16 • Frequency : Low • Axis : z • Task or measure : well being, fatigue, alertness
17 • Frequency : Medium • Axis : x • Task or measure : tracking
18 • Frequency : Medium • Axis : y • Task or measure : tracking
Long-Term Effects of Vibration on Complex Psychomotor Performance Physical description of the stressor (frequency, direction, magnitude, duration, regularity, crest) Threshold of acceptability Effects of exposure duration Conditions : lab, field study (aviation or other) Sample sizes and characterization : type (pilot or other), experience, gender, age, body measures Task/activities description : input details (display size, position), performance measures, training Human performance: continuous tracking, visual reaction time (response to a series of red and green lights), and auditory reaction time (response to a change in the frequency of an auditory signal); performance measures are taken during the first 45 min. of each h of a 6-h block; three 2 h practice sessions before the main experiment Comments Ref. 12 Frequency: 2, 5 Hz Magnitude: 0, 0.12, 0.16 rms G (acceleration power peak) Axis : z, y (random) Input: by a seat experiment. blocks.: two frequencies at three vibration levels (one control), duration per block: 6 h, counterbalanced order of blocks --- Improved tracking performance across experimental blocks reflects an adjustment to vibration. Improved tracking performance during the second and near the end of 6 h of one block indicates the danger of extrapolating long-term performance data from short exposures. Lab (electro-hydraulic vibration simulator) 12 cadets of the U.S. Air Force Advanced Reserve Officers Training Corps, having flight experience two independent experimental groups (N=6) for each frequency All vibration conditions lead to significant decline in tracking performance when compared with control conditions. Tracking performance on the horizontal axis is consistently better that that on the vertical axis. The 5 Hz spectrum is the most detrimental to tracking performance. Warning light performance is not affected by vibration. Auditory signal performance is not impaired at all: only one out of every 200 critical signal is not detected. References: Holland, C.L. Performance effects of long-term random vertical vibration. Human Factors, 9, 1967, pp. 93-104. Return to main table Other ref.
19 • Frequency : Medium • Axis : z • Task or measure : tracking
Effects of vertical medium frequency vibration on tracking Physical description of the stressor (frequency, direction, magnitude, duration, regularity, crest) Threshold of acceptability Effects of exposure duration Conditions : lab, field study (aviation or other) Sample sizes and characterization : type (pilot or other), experience, gender, age, body measures Task or measure/activities description : input details (display size, position), performance measures, training Comments Ref. 5.2 Frequency: 5 Hz Sinusoidal Axis : z 0.25 Peak G Input: by a chair with a widden seat At 5Hz vibration, large decrements are to be expected in tracking performance, at least for short-term exposure. Lab 10 male military members of the US Air Force, volunteers, ranging from 23 to 30 years Human performance: - tracking Task or measures - complex reaction time with calculating High level noise (100 - 110 dB) when combined with vibration produce more adverse effects than either of the stressors alone. References: Harris, C.S. & Sommer, H.C. (1973). Interactive effects of intense noise and low-level vibration on tracking performance and response time. Aerospace Medicine, 44, 1013-1016. Return to main table Other ref.
Ref. 1.1 Frequency: 5 Hz Sinusoidal Axis : z 0.30 Peak G Input: by a chair attached to vibration table Duration : 35 min Exposure to vibration causes a marked impairment of visual acuity and tracking ability. These vibrations increase reaction time to a green light extinction. Lab for aviation study 10 male military personnel Human performance : Tracking ability, mental arythmetic, reaction time, visual acuity, voice comm. Physiological measures : body temperature, heart rate, weight loss, subjective ratings of the stress. Combined-stress condition (heat, noise and vibrations) is less disturbing to the subjects and their performance than is vibration alone. References: GRETHER (W.F.) et al.: Effects of combined heat, noise and vibration stress on human performance and physiological functions. In: Aerospace Medicine, 1971, October, pp. 1092-1097. Return to main table Other ref.
Long-Term Effects of Vibration on Complex Psychomotor Performance Physical description of the stressor (frequency, direction, magnitude, duration, regularity, crest) Threshold of acceptability Effects of exposure duration Conditions : lab, field study (aviation or other) Sample sizes and characterization : type (pilot or other), experience, gender, age, body measures Task/activities description : input details (display size, position), performance measures, training Human performance: continuous tracking, visual reaction time (response to a series of red and green lights), and auditory reaction time (response to a change in the frequency of an auditory signal); performance measures are taken during the first 45 min. of each h of a 6-h block; three 2 h practice sessions before the main experiment Comments Ref. 12 Frequency: 2, 5 Hz Magnitude: 0, 0.12, 0.16 rms G (acceleration power peak) Axis : z, y (random) Input: by a seat experiment. blocks.: two frequencies at three vibration levels (one control), duration per block: 6 h, counterbalanced order of blocks --- Improved tracking performance across experimental blocks reflects an adjustment to vibration. Improved tracking performance during the second and near the end of 6 h of one block indicates the danger of extrapolating long-term performance data from short exposures. Lab (electro-hydraulic vibration simulator) 12 cadets of the U.S. Air Force Advanced Reserve Officers Training Corps, having flight experience two independent experimental groups (N=6) for each frequency All vibration conditions lead to significant decline in tracking performance when compared with control conditions. Tracking performance on the horizontal axis is consistently better that that on the vertical axis. The 5 Hz spectrum is the most detrimental to tracking performance. Warning light performance is not affected by vibration. Auditory signal performance is not impaired at all: only one out of every 200 critical signal is not detected. References: Holland, C.L. Performance effects of long-term random vertical vibration. Human Factors, 9, 1967, pp. 93-104. Return to main table Other ref.
Effects of Vibration Duration up to 60 Minutes on Manual Control Performance Physical description of the stressor (frequency, direction, magnitude, duration, regularity, crest) Threshold of acceptability Effects of exposure duration Conditions : lab, field study (aviation or other) Sample sizes and characterization : type (pilot or other), experience, gender, age, body measures Task/activities description : input details (display size, position), performance measures, training Human performance: continuous zero-oder tracking in one axis for 75 minutes, using isotonic or isometric side-arm controls with no arm support; Two-1 h practice sessions before the main experiment Comments Ref. 19 Frequency: static or 4 Hz Magnitude: 1.2 rms ms-2 Axis : z Input: by a seat two experimental runs à 75 min: 1. static condition, 2. 4 Hz sinusoidal vibration for 60 min. followed by no vibration (15 min.) --- Vibration does not alter the overall effect of duration. Lab (electro-dynamic vibrator) 8 subjects two independent groups for both controls (N=4) After 15 min.continuous performance there are large increases in overall error variance in both static and vibration conditions. This is due to large increases in response lags and suppression of coherent responses by the subjects due to the underarousing nature of the task (reduced level of arousal). Lewis, C.H. & Griffin, M.J. Mechanisms of the effects of vibration frequency, level, and duration on continuous manual control performance. Ergonomics, 22, 1979a, pp. 855-889. References: Return to main table Other ref.
Effects of Combined Noise, Vibration and Heat on Physiological, Biochemical, Cognitive, and Subjective Parameters Physical description of the stressor (frequency, direction, magnitude, duration, regularity, crest) Threshold of acceptability Effects of exposure duration Conditions : lab, field study (aviation or other) Sample sizes and characterization : type (pilot or other), experience, gender, age, body measures Task/activities description : input details (display size, position), performance measures, training Physiological measures: skin and rectal temperature, heart rate, weight loss, urine (collected for 24 hours), accelerometer Human performance: tracking, choice reaction time, communication test of logical alternatives, mental arithmetic, visual acuity Subjective ratings: stress severity scale, semantic differential regarding severity and intrusiveness of the stress conditions Comments Ref. 5 Frequency: 5 Hz Magnitude: 0.30 G (peak) Axis : z (sinusoidal) Input: by a chair other stressors: heat (22, 48 o C), noise (80, 105 dB) four experiment. combinations à 95 min.: 1. control, 2. vibration only, 3. vibration+heat, 4. vibration+ heat+noise --- --- Lab (mechanical vibration table) 12 male military personnel six of the 12 participated in an earlier experiment, 6 are new experienced subjects: 2 hours of retraining on performance tests; new subjetcs: 4 hours of training There are significant effects for skin and rectal temperatures, heart rate and weight loss probably caused by heat. However, effects due to heat cannot be isolated since there was no single heat condition. On tracking and reaction time tests the greatest impairment of performance is producred by single vibration. The combination of all stressors produces antagonistic rather than additive performance effects. Accelerometer measures indicate that transmissibility of vibration is not altered by heat or noise. Subjective ratings of stress severity progressively increase with the number of stressors; ratings of intrusiveness does not show such a trend. References: Grether, W.F. et al. Further study on combined heat, noise and vibration stress. Aerospace Medicine, 43, 1972, pp. 641-645. Return to main table Other ref.
Effects of Vibration Exposure Duration up to 202 Minutes on Complex Psychomotor Performance Physical description of the stressor (frequency, direction, magnitude, duration, regularity, crest) Threshold of acceptability Effects of exposure duration Conditions : lab, field study (aviation or other) Sample sizes and characterization : type (pilot or other), experience, gender, age, body measures Task/activities description : input details (display size, position), performance measures, training Human performance: continuous tracking in two axes using simplified aircraft dynamics plus button pressing to indicate when on target; Subjects are highly trained in short duration performance. Comments Ref. 25 Frequency: 4 Hz Magnitude: 1.4 rms ms- static, band random Axis : z Input: by a chair two separate experimental sessions à 202 min --- Performance significantly deteriotes with duration in all conditions and vibration does not alter the time dependence. Performance on session 2 is significantly better than on session 1 (training effect). Lab (electro-hydraulic vibrator) 14 subjects two independent groups of seven subjects each (vibration and no vibration) There is clearly an adaptation to the duration of performance even though subjects are trained at the tracking task for short durations. The effect of duration is attributed to muscular and mental fatigue. A vibration exposure above „fatigue-decreased-profiency“ boundary defined in ISO 2631 does not effect performance relative to no vibration performance. References: McLeod, R.W. & Griffin, M.J. (1989). A study of the effect of the duration of exposure to whole-body vibration on the performance of a complex task. Cited from: Griffin, M.J. (1990). Handbook of human vibration. Return to main table Other ref.
Effects of Vibration Frequency from 0.5 to 5.0 Hz on Manual Control Performance Physical description of the stressor (frequency, direction, magnitude, duration, regularity, crest) Threshold of acceptability Effects of exposure duration Conditions : lab, field study (aviation or other) Sample sizes and characterization : type (pilot or other), experience, gender, age, body measures Task/activities description : input details (display size, position), performance measures, training Human performance: combined continuous and discrete pursuit tracking task; Subjects are highly trained (at least 10 practice sessions à 3-min.). Comments Ref. 24 Frequency: 0.5-5.0 Hz Magnitude: 2.0 rms ms- Axis : z (sinusoidal) Input: by a seat two experimental sessions á 13 3-min. runs each: one warming up, one without, 11 with vibration, randomised orders --- --- Lab (electro-hydraulic vibrator) 8 male subjects 22-28 years Disruption of continuous performance is approximately constant at about 5% from 0.5 to 3.15 Hz and increases from 4.0 Hz up to 15% at 5 Hz. A visual mechanism is assumed to account for the increased disruption at higher frequencies. The vibration effect on discrete task is not disrupted by the frequency independently from the effects on the continuous task. References: McLeod, R.W. & Griffin, M.J. Performance of a complex manual control task during exposure to whole-body vertical vibration between 0.5 and 5.0 Hz. Ergonomics, 31, 1988, pp. 1193-1203. Return to main table Other ref.
Effects of Vibration on Manual Control Performance Physical description of the stressor (frequency, direction, magnitude, duration, regularity, crest) Threshold of acceptability Effects of exposure duration Conditions : lab, field study (aviation or other) Sample sizes and characterization : type (pilot or other), experience, gender, age, body measures Task/activities description : input details (display size, position), performance measures, training Human performance: zero-order tracking, side-arm control with no arm-rest, 1.1 m viewing distance (dependent variables: information channel capacity, frequency dependent error); one practice session Comments Ref. 17 Frequency: 3, 5, 8 Hz Magnitude: 0, 0.43, 0.87, 1.73 rms ms-2 Axis : z Input: by a seat four experimental sessions: combined sinusoidal components at three amplitudes each at three levels of control stiffness: 0, 0.08, 0.16 kg cm-1, one zero vibration condition --- --- Lab (electro-magnetic vibrator) 12 male subjects There is no significant difference between performance at the three stiffness levels with no vibration. Increasing the stiffness of the control reduces the disruption due to vibration which is due to an increased channel capacity during vibration. Vibration breakthrough contributes only a small proportion of total error, greatest disruption occurs at tracking frequencies below 4 Hz. References: Lewis, C. H. & Griffin, M. J. The effects of vibration on manual control performance. Ergonomics, 19, 1976, pp. 203-216. Return to main table Other ref.
Comparison of Display, Whole-Body and Simultaneous Whole-Body-and-Display Vibration on Reading Performance Physical description of the stressor (frequency, direction, magnitude, duration, regularity, crest) Threshold of acceptability Effects of exposure duration Conditions : lab, field study (aviation or other) Sample sizes and characterization : type (pilot or other), experience, gender, age, body measures Task/activities description : input details (display size, position), performance measures, training Human performance: numeral reading of a CRT display (characters subtend 5 min arc and 12 min arc at 0.75 m) Comments Ref. 27 Frequency: 0.5-5.0 Hz Magnitude: 1.0-2.5 rms ms-2 Axis : z (sinusoidal) Input: by a seat experimental conditions: 11 frequencies at 5 magnitudes (55 stimuli), three blocks: 1. display, 2. subject, 3. subject+display vibrating, randomised order --- --- Lab (hydraulic vibrator) 15 male subjects all under 30 years For frequencies below 4 Hz display vibration produces the largest performance decrements and whole-body-and-display vibration the least. Whole-body vibration with a stationary display produces significantly worse performance than simultaneous vibration of both observer and display but significantly better performance than display vibration alone. The variations in performance with frequency and viewing condition are consitent across all vibration magnitudes. References: Moseley, M.J. & Griffin, M.J. Effects of display vibration and whole-body vibration on visual performance. Ergonomics, 29, 1986, pp. 977-983. Return to main table Other ref.
Interaction of Control Gain and Vibration with Manual Control Performance Physical description of the stressor (frequency, direction, magnitude, duration, regularity, crest) Threshold of acceptability Effects of exposure duration Conditions : lab, field study (aviation or other) Sample sizes and characterization : type (pilot or other), experience, gender, age, body measures Task/activities description : input details (display size, position), performance measures, training Human performance: zero order tracking in one axis with four different controls (isotonic (=displacement) and isotronic (= force) joysticks and knobs); one practice session of 4.5 h (static condition) Comments Ref. 18 Frequency: static or 4 Hz sinusoidal Magnitude: 0.75 rms ms-2 Axis : z Input: by a seat four experimental blocks with different control gain conditions: isometric and isotonic joysticks and knobs with gains from 12.5-50 cm/radian for isotonic and 2.5-10cm/radian for isometric controls --- --- Lab (electro-dynamic vibrator) 4 male subjects 18-26 years right-handed There is a significant interaction between control gain and vibration: the optimum control gain for minimizing tracking error under a given vibration condition is likely to be lower than that for minimizing error under static conditions due to increases in vibration-correlated error and non-linear response which both tend to depend on control gain. Lewis, C. H. & Griffin, M. J. The interaction of control gain and vibration with continuous manual control performance. Journal of Sound and Vibration, 55, 1977, pp. 553-562. References: Return to main table Other ref.
Interaction of Control Gain and Vibration with Manual Control Performance Physical description of the stressor (frequency, direction, magnitude, duration, regularity, crest) Threshold of acceptability Effects of exposure duration Conditions : lab, field study (aviation or other) Sample sizes and characterization : type (pilot or other), experience, gender, age, body measures Task/activities description : input details (display size, position), performance measures, training Human performance: zero order tracking in one axis with four different controls (isotonic (=displacement) and isotronic (= force) joysticks and knobs); one practice session of 4.5 h (static condition) Comments Ref. 18 Frequency: static or 4 Hz sinusoidal Magnitude: 0.75 rms ms-2 Axis : z Input: by a seat four experimental blocks with different control gain conditions: isometric and isotonic joysticks and knobs with gains from 12.5-50 cm/radian for isotonic and 2.5-10cm/radian for isometric controls --- --- Lab (electro-dynamic vibrator) 4 male subjects 18-26 years right-handed There is a significant interaction between control gain and vibration: the optimum control gain for minimizing tracking error under a given vibration condition is likely to be lower than that for minimizing error under static conditions due to increases in vibration-correlated error and non-linear response which both tend to depend on control gain. Lewis, C. H. & Griffin, M. J. The interaction of control gain and vibration with continuous manual control performance. Journal of Sound and Vibration, 55, 1977, pp. 553-562. References: Return to main table Other ref.
Effects of vertical medium frequency vibration on tracking Physical description of the stressor (frequency, direction, magnitude, duration, regularity, crest) Threshold of acceptability Effects of exposure duration Conditions : lab, field study (aviation or other) Sample sizes and characterization : type (pilot or other), experience, gender, age, body measures Task or measure/activities description : input details (display size, position), performance measures, training Comments Ref. 1.3 Frequency: 5 Hz Sinusoidal Axis : z 0.30 Peak G Input: by a chair attached to vibration table Duration : 35 min Exposure to vibration causes a marked impairment of visual acuity and tracking ability. Lab for aviation study 10 male military personnel Human performance : Tracking ability, mental arythmetic, reaction time, visual acuity, voice comm. Physiological measures : body temperature, heart rate, weight loss, subjective ratings of the stress. Combined-stress condition (heat, noise and vibrations) is less disturbing to the subjects and their performance than is vibration alone. References: GRETHER (W.F.) et al.: Effects of combined heat, noise and vibration stress on human performance and physiological functions. In: Aerospace Medicine, 1971, October, pp. 1092-1097. Return to main table Other ref.
20 • Frequency : Medium • Axis : x • Task or measure : manipulating
21 • Frequency : Medium • Axis : y • Task or measure : manipulating
22 • Frequency : Medium • Axis : z • Task or measure : manipulating
Effects of Broadband Noise and Complex Waveform Vibration on Cognitive Performance Physical description of the stressor (frequency, direction, magnitude, duration, regularity, crest) Threshold of acceptability Effects of exposure duration Conditions : lab, field study (aviation or other) Sample sizes and characterization : type (pilot or other), experience, gender, age, body measures Task/activities description : input details (display size, position), performance measures, training Human performance: complex counting task (CCT): simultaneous count of the number of flashes of three lights; subject has to press each light`s button every sixth time it flashed; two practice sessions à 30 min. Comments Ref. 10 Frequency: 2.6, 4.1, 6.3, 10, 16 Hz Magnitude: 0.36 rms G quasi-random sum-of-sines vibrations Axis : z Input: by a seat other stressor: broadband noise at two levels (65 and 100 dBA) four 30 min. experimental sessions, different randomised orders --- Trend of the data suggest that, for longer exposure durations, the drop in performance would have been significantly greater when vibration is present than it is not. Lab (electro-dynamic shaker) 12 male Air Force military personnel members of the AMRL Vibration panel 23-40 years 100 dBA noise and the combination of 65 dBA noise and vibration produce significantly poorer performance than 65 dBA noise alone or combined 100 dBA noise and vibration. Harris, C.S. & Shoenberger, R.W. Combined effects of broadband noise and complex waveform vibration on cognitive performance. Aviation, Space and Environmental Medicine, 51, 1980, pp. 1-5. References: Return to main table Other ref.
23 • Frequency : Medium • Axis : x • Task or measure : communication
24 • Frequency : Medium • Axis : y • Task or measure : communication
25 • Frequency : Medium • Axis : z • Task or measure : communication
Effects of vertical medium frequency vibration on tracking Physical description of the stressor (frequency, direction, magnitude, duration, regularity, crest) Threshold of acceptability Effects of exposure duration Conditions : lab, field study (aviation or other) Sample sizes and characterization : type (pilot or other), experience, gender, age, body measures Task or measure/activities description : input details (display size, position), performance measures, training Comments Ref. 1.3 Frequency: 5 Hz Sinusoidal Axis : z 0.30 Peak G Input: by a chair attached to vibration table Duration : 35 min Exposure to vibration causes a marked impairment of visual acuity and tracking ability. Lab for aviation study 10 male military personnel Human performance : Tracking ability, mental arythmetic, reaction time, visual acuity, voice comm. Physiological measures : body temperature, heart rate, weight loss, subjective ratings of the stress. Combined-stress condition (heat, noise and vibrations) is less disturbing to the subjects and their performance than is vibration alone. References: GRETHER (W.F.) et al.: Effects of combined heat, noise and vibration stress on human performance and physiological functions. In: Aerospace Medicine, 1971, October, pp. 1092-1097. Return to main table Other ref.