Download
1 / 28
592 likes | 1.3k Views
Chapter 11 Project Analysis and Evaluation. 11.1 Evaluating NPV Estimates 11.2 Scenario and Other “What-if” Analyses 11.3 Break-Even Analysis 11.4 Operating Cash Flow, Sales Volume, and Break-Even 11.5 Operating Leverage 11.6 Additional Considerations in Capital Budgeting

E N D
Chapter 11Project Analysis and Evaluation • 11.1 Evaluating NPV Estimates • 11.2 Scenario and Other “What-if” Analyses • 11.3 Break-Even Analysis • 11.4 Operating Cash Flow, Sales Volume, and Break-Even • 11.5 Operating Leverage • 11.6 Additional Considerations in Capital Budgeting • 11.7 Summary and Conclusions Vigdis BoassonMgf301, School of Management, SUNY at Buffalo
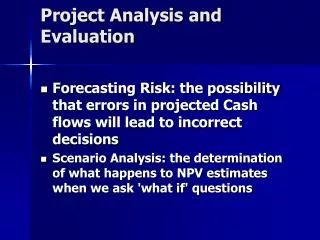
11.2 Evaluating NPV Estimates I: The Basic Problem • The Basic Problem: How reliable is our NPV estimate? • Projected vs. actual cash flows Estimated cash flows are based on a distribution of possible outcomes each period • Forecasting risk The possibility of a bad decision due to errors in cash flow projections - the GIGO phenomenon • Sources of value What conditions must exist to create the estimated NPV? “What If” analysis A. Scenario analysis B. Sensitivity analysis
11.3 Evaluating NPV Estimates II: Scenario and Other “What-If” Analyses • Scenario and Other “What-If” Analyses • “Base case” estimation Estimated NPV based on initial cash flow projections • Scenario analysis Posit best- and worst-case scenarios and calculate NPVs • Sensitivity analysis How does the estimated NPV change when one of the input variables changes? • Simulation analysis Vary several input variables simultaneously, then construct a distribution of possible NPV estimates
11.4 Fairways Driving Range Example • Fairways Driving Range expects rentals to be 20,000 buckets at $3 per bucket. Equipment costs are $20,000 depreciated using SL over 5 years and have a $0 salvage value. Variable costs are 10% of rentals and fixed costs are $45,000 per year. Assume no increase in working capital nor any additional capital outlays. The required return is 15% and the tax rate is 15%. Revenues (20k x $3): $60,000 Variable Costs (.10 x 60k): 6,000 Fixed Costs: 45,000 Depreciation (20k /5yrs): 4,000 EBIT: 5,000 Taxes (@15%) 750 Net Income $ 4,250
11.4 Fairways Driving Range Example (concluded) • Estimated annual cash inflows: $5,000 + 4,000 - 750 = $8,250 • r= 15%, t=5. The base-case NPV is: NPV = -I + C x {1 - [1/(1 + r)t]}/r NPV = $-20,000 + ($8,250 {1 - [1/(1.15)5]}/.15) = $7,654.
11.5 Fairways Driving Range Scenario Analysis INPUTS FOR SCENARIO ANALYSIS Scenario analysis: putting lower and upper bounds on cash flows. Poor revenues with high costs, high revenues with low costs. • Base Case: Rentals are 20,000 buckets, variable costs are 10% of revenues, fixed costs are $45,000, depreciation is $4,000 per year, and the tax rate is 15%. • Best Case: Rentals are 25,000 buckets, variable costs are 8% of revenues, fixed costs are $45,000, depreciation is $4,000 per year, and the tax rate is 15%. • Worst Case: Rentals are 15,000 buckets, variable costs 12% of revenues, fixed costs are $45,000, depreciation is $4,000 per year, and the tax rate is 15%.
11.5 Fairways Driving Range Best Case Scenario • Best Case: Rentals are 25,000 buckets, variable costs are 8% of revenues, fixed costs are $45,000, depreciation is $4,000 per year, and the tax rate is 15%. Revenues (25k x $3): $75,000 Variable Costs (.08 x 75k): 6,000 Fixed Costs: 45,000 Depreciation (20k /5yrs): 4,000 EBIT: 20,000 Taxes (@15%) 3,000 Net Income $ 17,000 OCF = EBIT + Dep. - Taxes = 20,000 + 4,000 - 3,000 = 21,000
11.5 Fairways Driving Range:Worst Case Scenario • Worst Case: Rentals are 15,000 buckets, variable costs 12% of revenues, fixed costs are $45,000, depreciation is $4,000 per year, and the tax rate is 15%. Revenues (15k x $3): $45,000 Variable Costs (.12 x 45k): 5,400 Fixed Costs: 45,000 Depreciation (20k /5yrs): 4,000 EBIT: -9,400 Taxes (@15%) 0 Net Income $ -9,400 OCF = EBIT + Dep. - Taxes = -9,400 + 4,000 - 0 = -5,400
11.5 Fairways Driving Range Scenario Analysis (concluded) Scenario Rentals(units) Revenues Net Income Cash Flow Best Case 25,000 $75,000 $17,000 $21,000 Base Case 20,000 60,000 4,250 8,250 Worst Case 15,000 45,000 -9,400 -5,400 Note that the worst case results in a tax credit. This assumes that the owners had other income against which the loss is offset.
11.6 Fairways Driving Range Sensitivity Analysis INPUTS FOR SENSITIVITY ANALYSIS Sensitivity analysis: hold all projections constant except one, alter that one, and see how sensitive cash flow is to that one when it changes - the point is to get a fix on where forecasting risk may be especially severe. • Base Case: Rentals are 20,000 buckets, variable costs are 10% of revenues, fixed costs are $45,000, depreciation is $4,000 per year, and the tax rate is 15%. • Best Case: Rentals are 25,000 buckets and revenues are $75,000. All other variables are unchanged. • Worst Case: Rentals are 15,000 buckets and revenues are $45,000. All other variables are unchanged.
11.6 Fairways Driving Range : Best Case Sensitivity Analysis • Best Case: Rentals are 25,000 buckets, variable costs are 10% of revenues, fixed costs are $45,000, depreciation is $4,000 per year, and the tax rate is 15%. Revenues (25k x $3): $75,000 Variable Costs (.10 x 75k): 7,500 Fixed Costs: 45,000 Depreciation (20k /5yrs): 4,000 EBIT: 18,500 Taxes (@15%) 2,775 Net Income $ 15,725 OCF = EBIT + Dep. - Taxes = 18,500 + 4,000 - 2,775 = 19,725 NPV = $-20,000 + ($19,725 {1 - [1/(1.15)5]}/.15) = $46,121.
11.6 Fairways Driving Range :Worst Case Sensitivity Analysis • Worst Case: Rentals are 15,000 buckets, variable costs are 10% of revenues, fixed costs are $45,000, depreciation is $4,000 per year, and the tax rate is 15%. Revenues (15k x $3): $45,000 Variable Costs (.10 x 45k): 4,500 Fixed Costs: 45,000 Depreciation (20k /5yrs): 4,000 EBIT: -8,500 Taxes (@15%) 1,275 Net Income -$ 7,225 OCF = EBIT + Dep. - Taxes = -8,500 + 4,000 + 1,275 = -3,225 *Assume a tax credit is created in the worst case. NPV = $-20,000 + (-3,225 {1 - [1/(1.15)5]}/.15) = -$30,811.
11.6 Fairways Driving Range Sensitivity Analysis (concluded) Scenario Rentals Revenues Net Income Cash Flow NPV Best Case 25,000 $75,000 $15,725 $19,725 $46,121 Base Case 20,000 60,000 4,250 8,250 $7,655 Worst Case 15,000 45,000 -7,225 -3,225 -$30,811 Note that the worst case results in a tax credit. This assumes that the owners had other income against which the loss is offset.
11.7 Fairways Driving Range: Rentals vs. NPV Fairways Sensitivity Analysis - Rentals vs. NPV NPV Best case NPV = $46,121 $60,000 x Base case NPV = $7,655 x 0 Worst case NPV = -$30,811 x -$60,000 25,000 15,000 20,000 Rentals per Year
11.8 Fairways Driving Range: Total Cost Calculations • TC = VC + FC TC = (Q x v ) + FC Rentals Variable Cost Fixed Cost Total Cost 0 $0 $45,000 $45,000 15,000 4,500 45,000 49,500 20,000 6,000 45,000 51,000 25,000 7,500 45,000 52,500
11.9 Fairways Driving Range: Break-Even Analysis Fairways Break-Even Analysis - Sales vs. Costs and Rentals Sales and Costs Total Revenues $80,000 Break-Even Point 18,148 Buckets Net Income > 0 $50,000 Fixed Costs + Dep $49,000 Net Income < 0 $20,000 25,000 15,000 20,000 Rentals per Year
11.10 Fairways Driving Range: Accounting Break-Even Quantity • Fairways Accounting Break-Even Quantity (Q) Q = (Fixed costs + depreciation)/(Price per unit - variable cost per unit) = (FC + D)/(P - v) = ($45,000 + 4,000)/($3.00 - .30) = 18,148 buckets
11.11 Chapter 11 Example Assume you have the following information: • Price = $5 per unit; variable costs = $3 per unit • Fixed operating costs = $10,000 • Initial cost is $20,000 • 5 year life; straight-line depreciation to 0, no salvage value • Assume no taxes • Required return = 20%
11.11 Chapter 11 Example • Break-Even Computations A. Accounting Break-Even Q = (FC + D)/(P - v) = ($10,000 + $4,000)/($5 - 3) = 7,000 units. EBIT = 5 x 7,000 - 3 x 7,000 - 10,000 - 4,000) = 0 OCF = 0 + 4,000 - 0 = 4,000 r = 20% t = 5 years Initial cost = $20,000 IRR = 0 ; NPV = -$8,038
11.11 Chapter 11 Example • Break-Even Computations B. Cash Break-Even Q = FC/(P - v) = $10,000/($5 - 3) = 5,000 units. EBIT = 5 x 5,000 - 3 x 5,000 - 10,000 - 4,000) = -4,000 OCF = -4,000 + 4,000 - 0 = 0 r = 20% t = 5 years Initial cost = $20,000 IRR = -100% ; NPV = -$20,000
11.11 Chapter 11 Example • C. Financial Break-Even Q = (FC + OCF)/(P - v), where OCF is the level of OCF that results in a zero NPV. A project that breaks even on a financial basis has a discounted payback equal to its life, a zero NPV, and IRR just equal to the required return. NPV = -I + C x {1 - [1/(1 + r)t]}/r C x {1 - [1/(1 + r)t]}/r = NPV + I NPV = 0, r = 20%, t = 5 years, Initial cost = $20,000 C x {1 - [1/(1.205]}/.20 = 0 + 20,000 C x 2.9906 = 20,000 C = 20,000 / 2.9906 = 6,688 Q = (FC + OCF)/(P - v)=($10,000 + 6,688)/($5 - 3) = 8,344 units IRR = 20% ; NPV = 0, Payback=5 years.
11.12 Summary of Break-Even Measures (Table 11.1) I. The General Expression Q = (FC + OCF)/(P - v) where: FC = total fixed costs, P =Price per unit, v =variable cost per unit. II. The Accounting Break-Even Point Q = (FC + D)/(P - v) At the Accounting BEP, Net income = 0. III. The Cash Break-Even Point Q = FC/(P - v) At the Cash BEP, OCF = 0. IV. The Financial Break-Even Point Q = (FC + OCF*)/(P - v) At the Financial BEP, NPV = 0. (OCF* is the OCF at which NPV = 0.)
11.13 Fairways Driving Range: Degree of Leverage (DOL) • DOL is a “multiplier” which measures the effect of a change in quantity sold on OCF. • % in OCF = DOL % in Q • DOL = 1 + FC/OCF • For Fairways, let Q = 20,000 buckets. Ignoring taxes, OCF = $9,000 and fixed costs = $45,000. Fairway’s DOL = 1 + FC/OCF = 1 + $45,000/$9,000 = 6.0. In other words, a 10% increase (decrease) in quantity sold will result in a (6 x 10%) = 60% increase (decrease) in OCF. • Higher DOL suggests greater volatility (i.e., risk) in OCF. • Leverage is a two-edged sword - sales decreases will be magnified as much as increases.
11.14 Managerial Options and Capital Budgeting • Managerial options and capital budgeting • What is ignored in a static DCF analysis? Management’s ability to modify the project as events occur. • Contingency planning 1. The option to expand 2. The option to abandon 3. The option to wait • Strategic options Possible future investments that may result from an investment under consideration. Generally, the exclusion of managerial options from the analysis causes us to underestimate the “true” NPV of a project.
11.15 Capital Rationing • Capital rationing • Definition: The situation in which the firm has more good projects than money. • Soft rationing - limits on capital investment funds set within the firm. • Hard rationing - limits on capital investment funds set outside of the firm (i.e., in the capital markets).
11.17 Solution to Problem 11.1 • BetaBlockers, Inc. (BBI) manufactures sunglasses. The variable material cost is $0.63 per unit and the variable labor cost is $2.02 per unit. a. What is the variable cost per unit? VC = variable material cost + variable labor cost = $0.63 + $2.02 = $2.65 b. Suppose BBI incurs fixed costs of $415,000 during a year when production is 250,000 units. What are total costs for the year? TC = total variable costs + fixed costs = ($2.65)(250,000) + $ 415,000 = $ 1,077,500
11.17 Solution to Problem 11.1 (concluded) c. If the selling price is $5.50 per unit, does BBI break even on a cash basis? If depreciation is $150,000, what is the accounting break-even point? Q cash= (FC ) / (P - v) = $415,000/($5.5 - $ 2.65) = 145,614 units Q account = (FC + Dep) / (P - v) = ($415,000 + $ 150,000)/($5.50 - $2.65) = 198,246 units
11.18 Solution to Problem 11.13 • A proposed project has fixed costs of $25,000 per year. OCF at 4,000 units is $60,000. 1. Ignoring taxes, what is the degree of operating leverage (DOL)? DOL = 1 + FC/OCF = 1 + ($25,000/$60,000) = 1.4167 2. If quantity sold rises from 7,000 to 7,300, what will the increase in OCF be? % Q = (7,300 - 7,000)/7,000 = 4.29% % OCF = DOL(% Q) =1.4167 x 4.29% = 6.07% New OCF = ($60,000)(1.0607) = $63,642 3. What is the new DOL? DOL at 7,300 units = 1 + ($25,000/$63,642) = 1.3928