Download
1 / 8
80 likes | 351 Views
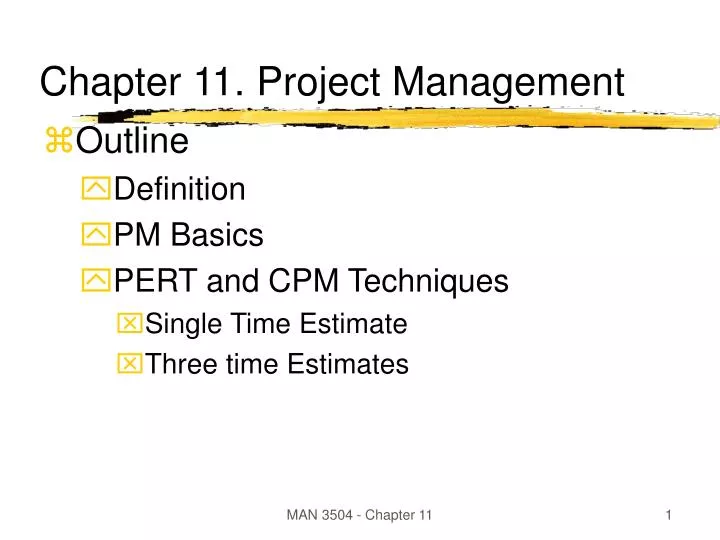
Chapter 11. Project Management. Outline Definition PM Basics PERT and CPM Techniques Single Time Estimate Three time Estimates. Project Management. The design and control of the activities and resources require to complete a major output Typically a new or complex output

E N D
Chapter 11. Project Management • Outline • Definition • PM Basics • PERT and CPM Techniques • Single Time Estimate • Three time Estimates MAN 3504 - Chapter 11
Project Management • The design and control of the activities and resources require to complete a major output • Typically a new or complex output • Requires multiple activities with precedence constraints (not all activities can be done simultaneously), but some are done in parallel. • Utilizes multiple resources, in many cases both internal and external to the organization managing the project. MAN 3504 - Chapter 11
Project Management MAN 3504 - Chapter 11
PERT/CPM • Two tools to plan and track projects developed in the 50’s • Project Evaluation and Review Technique (PERT ) • Critical Path Method (CPM) • As the methods have evolved, they are basically the same • One case we utilize a single time estimate for each activity, in the other we use three time estimates. • Objective: • What is the expected completion time of the project • What activities are in the critical path MAN 3504 - Chapter 11
PERT/CPM with a Single Time Estimate - the process 1 )List all the activities per order of precedence, starting with the activities that have no precedences. 2 )Create a diagram of all the activities, connecting those that have a precedence constraint. Point the arrow in the direction of time (the next step). 3 )Calculate a Early Start (ES) and Early Finish (EF) time for each activity. ES is earliest time that an activity can start given its precedence activities, therefore the EF of the predecessors. If an activity has two or more predecessors, the largest EF of the predecessors is the ES of the activity. EF = ES + activity time. 4)The largest EF is the expected completion time of the project. MAN 3504 - Chapter 11
PERT/CPM with a Single Time Estimate - the process 5) For the last activity, the Late Start (LS) and the Late Finish (LF) are the same as the Early Start and the Early Finish respectively. 6)Move the LS from the activity to all the predecessors’ LF. If the activity is a predecessor to more than one activity, select the smallest LS. LS = LF - activity time. 7)Repeat step 6 until all activities have a LS and LF. 8)Calculate the slack of each activity. S = LS – ES. 9) Activities with a slack of 0 are in the critical path. Note that it is possible to have multiple critical paths. MAN 3504 - Chapter 11
PERT/CPM with Three Time Estimates - the process 1 )For each activity j calculate a mean (Mj): Mj = (Kj + 4*Lj + Nj)/6 and the activity variance s2j:s2j= [(Nj – Kj)/ 6]2 2)Calculate the completion time (CT) and critical path as in the single time estimate case using the mean time for each activity. 3) Calculate the sum of the variances for the CP: s2CP = SUM (s2j for all j in the CP) 4) Calculate the probability of completing the project before time U: P( X U ) by: a) Determine the Z value: Z = (U – CT )/ (sqrt[s2CP]) b) Look up the probability using the Z value in Table 11.1. Note that Table 11.1 contains the areas of the cumulative standard Normal distribution. A point in the table is the proportion under the curve cumulated from the negative tail (see Figure 11.4) MAN 3504 - Chapter 11
Project Management -Phase II • Plans often are based on optimistic estimates • Resources are pulled in multiple directions • Unexpected events • Use of software: • Primavera • Microsoft Project MAN 3504 - Chapter 11