Download
1 / 53
530 likes | 639 Views
Resonant mass detectors. Pia Astone 4 th Amaldi conference Perth July 8-13, 2001. ….these early experiments initiated research into gravitational waves experiments that is still ongoing. Current g.w. experiments are

E N D
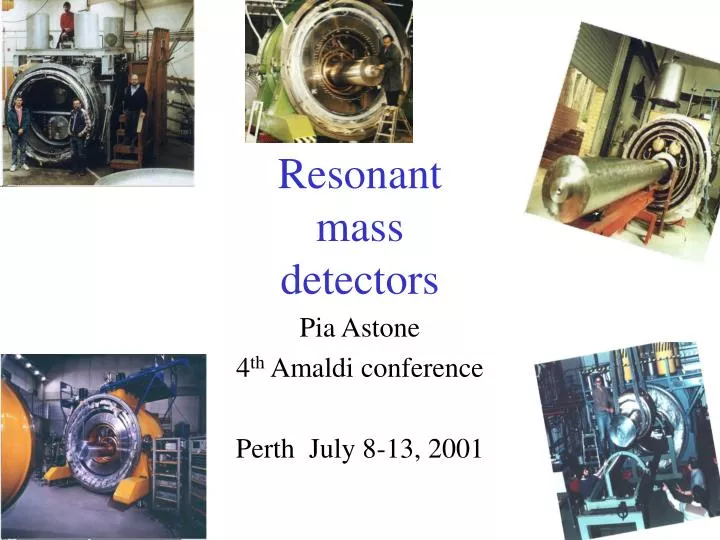
Resonant mass detectors Pia Astone 4th Amaldi conference Perth July 8-13, 2001
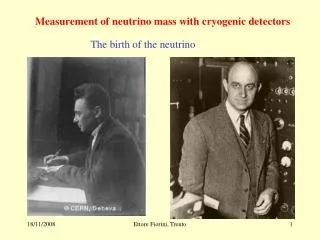
….these early experiments initiated research into gravitational waves experiments that is still ongoing. Current g.w. experiments are descendants of Weber’s original work
The Eq of geodetic deviation is the basis for all the experiments to detect g.w. M ; T ; Q They play a role that is similar to L ; P ; F for interferometers Thermal noise, T=300mK, DL=3 10-18 m
ALLEGRO: 2300 kg, Al antenna, The two resonance frequencies are 897 and 920 Hz. Cooled at 4.2K Operational since 1991 IT IS IN BATON ROUGE, LOUISIANA (U.S.A.) Main characteristics of the detectors AURIGA: 2230 kg, Al antenna Cooled at 200 mK, with a liquid helium dilution refrigerator The two resonance frequencies are 921 and 930 Hz Operational since 1997 IT IS IN LEGNARO (PADOVA) Explorer : 2270 kg, Al antenna Cooled at 2.6 K The two resonance frequencies are 888 and 919 Hz Operational since 1990 IT IS AT CERN NAUTILUS: 2260 kg, Al antenna Cooled at 130 mK, with a liquid helium dilution refrigerator The two resonance frequencies are 905 and 924 Hz Operational since Dec. 1995 IT IS IN FRASCATI (ROME) Niobe: 1500 kg, Niobium antenna Cooled at 5 K. The two resonance frequencies are 694 and 713 Hz Operational since 1993 IT IS HERE
Bars can look for: The expected signal h is a short pulse ( a few ms). Bursts The expected value on Earth, if 1% of Mo is converted into g.w. in the GC, is of the order of 10-18
Bars can look for: h h Time[s] Two collapsed objects ( 2 neutron stars, 2 black holes, one of each) , that orbit each other at close range and high orbital frequency. Amplitude and frequency increase with time, until the final merge. Chirp
Bars can look for: Continuous signals Signals from rotating neutron stars, stars in binary systems
Bars can look for: Stochastic background Noise, produced from a high number of uncorrelated events Cosmological origin: it is the result of processes that happened immediately after the Big-Bang. If measured, it will allow to discriminate various cosmological models Astrophysical origin: it is the result of more recent event (redshift z order of 2-5). It is due to unresolved processes of gravitational collapses. It will provide information on star formation rates, supernova rates, black holes......
AN EXAMPLE OF STRAIN SENSITIVITY of a resonant g.w. detector Sqrt(T/MQ) Note that the bandwidth depends ONLY on the transducer and amplifier Calibration signal NAUTILUS 1999
ON times for the various detectors 1997-2001 200 d 221 d 852 d 553 d 659 d
THE ALLEGRO DETECTOR IS VERY STATIONARY AND HAS A VERY HIGH DUTY CYCLE ALLEGRO 1998 Tobs= 328 days !! h=1*10-18 Talk by S. Heng
The AURIGA sensitivity (first run 97-99) July, 1999 h=2.5 10-19 4 10-22 /sqrt(Hz) B=6 Hz Talk by A. Ortolan
Explorer , Nautilus and Niobe are now working with a sensitivityofh=4-5*10-19 1-14 June 2001 h=7*10-19 h=4*10-19 Talks by Visco, Coccia, Blair
ALLEGRO: It has been relocated and will be again on the air in a few weeks. (2.0 *10-21 /sqrt(Hz), B= 1 Hz) Next: It will be equipped with a new 2-mode transducer and with a Wellstood SQUID amplifier. The expected bandwidth is 60 Hz, and the expected strain sensitivity 1 *10-21/sqrt(Hz) NEWS on the detectors AURIGA: A new readout (new double stage SQUID, new tranducer) is being tested. New mechanical suspensions (360 dB @1kHz). The system will be operative before the end of this year. The expected strain sensitivity is 6*10-22/sqrt(Hz) B=40 Hz @1*10-21/sqrt(Hz) Phase I (2001) 2*10-22 /sqrt(Hz) B=80 Hz @1*10-21/sqrt(Hz) Phase II (2002) Explorer : the tranducer and the SQUID have been replaced . This year: increase the Q of the transducer to increase the strain sensitivity. Work on the SQUID (to reduce extra noise) We expect a bandwidth of 30 Hz@ 3*10-21 /sqrt(Hz); Next year: Install cosmic ray detectors around the bar NAUTILUS: after the summer the bar will be replaced and the new system will work at 935 Hz; A new transducer and SQUID (the same used for Explorer) will be used (to increase the sensitivity) We expect: 6*10-23 /sqrt(Hz) @935 Hz Niobe: it has been cooled down again in Feb. 2001. The readout system has been improved, to increase the sensitivity (new low noise micro wave amplifier) The antenna has been equipped with cosmic ray detectors (Univ. of Adelaide osmic ray detector array)
Explorer strain sensitivity(2000-2001) But the system was not stable in this situation AND.. 10-20 /sqrt(Hz) 10-21 /sqrt(Hz)
Explorer strain sensitivity present condition -18 10 decreasing electronic noise -19 10 GW spectral amplitude (h/rt(Hz)) increasing Q and decreasing electronic noise -20 10 -21 10 880 890 900 910 920 930 940 950 frequency (Hz) GOAL for this year : Sh=(1 10-21 /sqrt(Hz))2 B=30 Hz @ 3 10-21 /sqrt(Hz) Calibration 1/sqrt(Hz) 10-21 10-20 3 10-21
The expected AURIGA strain sensitivity: Phase I (2001) Operating Temperature 1.5 K Talk by J.P. Zendri; Posters by Vinante, Marin Sh=(6 10-22 /sqrt(Hz))2 B=40 Hz @ 1 10-21 /sqrt(Hz) h=1.3 10-19(burst) Phase II (2002) Operating Temperature 100 mK Sh=(2 10-22 /sqrt(Hz))2 B=80 Hz @ 1 10-21 /sqrt(Hz) h=5 10-20(burst)
Optical readout for AURIGA • Bar motion read by FP cavity, mounted between the bar and the resonant transducer • May 2001: the system has been operating on a room temperature bar, in Legnaro (10 days) Next steps: Underst. agreement with model Test optomechanical parts at low temperature Develop and test a cryogenic prototype 10-19 /sqrt(Hz) 10-20 /sqrt(Hz) Talk by M. De Rosa 820 940
NAUTILUS at 935 Hz (after the summer): expected strain sensitivity with the new transducer 1/sqrt(Hz) 10-20 10-21 10-22 6*10-23/sqr(Hz) @935 Hz 10-22 870 970 Hz 840 Hz 980
ON times for the various detectors 1997-2000 186 d 221 d 852 d 416 d 554 d
Results of the First Analysis(1997-1998 data, old protocol) No detection of g.w. bursts above h=4 x 10 -18 Discussion for IGEC: refer to the talk of G. Prodi at this conference That is no events which converted 0.07 solar masses in the Galaxy
Net observation times(1997-2000 data-New protocol) • 1 detector: 1322 (past:625) days • 2 detectors: 713 (past:260) days • 3 detectors: 178 (past: 90) days • 4 detectors: 29 (past: 16) days • 5 detectors: 0 (past: 0) days The total span of the time of the analysis is 4 years=1460 days In case of an astronomical trigger, the time coverage is 90%, over 4 years
Search for bursts-what we plan to do- • Analysis of the 1997-2000 IGEC data (new protocol more information). New algorithms. • We are preparing for future analysis in collaboration with interferometers : 1) use of Frames 2) study of the problem (waveforms versus detector’s bandwidth) The use of FRAMES for the AURIGA detector: see the poster of Gabriele Vedovato Optimum filters for bursts: see the poster of Sabrina D’ Antonio
EXPLORER and NAUTILUS Feb. 1997 Crosscorrelation measurement of stochastic g.w. background with two resonant detectors (Astr. Astroph 351,1999) (see also Phys. Lett. B, 385, 1996) Sh Hz-1 12 hours of data Bandw.=0.1 Hz 10-38 Omega_gw < 6*10 10-40 10-42 905 925 Hz
Stochastic g.w. background-what we plan to do- • New limit using AURIGA I and NAUTILUS: with t_obs=4 month; ShN=(6*10-23- 1*10-22)2 1/Hz ; ShA=(1*10-21 )2 1/Hz @935 Hz Omega_gw=10-1, Df=1 HzYear 2002 (a factor 2 better if AURIGA is tuned at 935 Hz) . Joint analysis with Virgo (ShV=(1*10-22)2 1/Hz@ 900 Hz): Virgo – AURIGA II: 3*10 –3(1 year, Df=80 Hz) Virgo – NAUTILUS: 5*10 –3(1 year, Df= 1 Hz) (and also: Virgo-AURIGA-NAUTILUS). S. Vitale et al. Phys. Rev D, 55,1997;Maggiore Phys Rep. 331.6 ,2000 • Joint analysis with LIGO. LIGO–ALLEGRO : 10-1 - 6*10 –4( 40 km apart) S. Finn, A. Lazzarini grqc0104040 (2001)
0.1 is obtained using LIGO I (h(f)=10-22 1/sqrt(Hz) at 1kHz ) the present ALLEGRO (h(f)=2*10-21 1/sqrt(Hz)) 1 year (analysis done at pieces of 2-3 months) and a bandwodth of 1 Hz 3*10-4 is obtained using LIGO II (h(f)=10-23 1/sqrt(Hz) at 1kHz) Improved ALLEGRO h(f)=10-22 1/sqrt(Hz) 1 year (analysis done at pieces of 2-3 months) and a bandwodth of 50 Hz W=0.1 can be obtained using LIGO I (h(f)=10-22 1/sqrt(Hz) at 1kHz ) the present ALLEGRO (h(f)=2*10-21 1/sqrt(Hz)) 1 year (analysis done with periods of 2-3 months) and a bandwidth of 1 Hz W=6*10-4 is obtained using LIGO II (h(f)=10-23 1/sqrt(Hz) at 1kHz) Improved ALLEGRO h(f)= 1 10-21 1/sqrt(Hz) 1 year (analysis done with periods of 2-3 months) and a bandwidth of 60 Hz
Continuous wave analysis • Limits for signals in the GC and Tucanae has been obtained using 3 months of ALLEGRO 1994 data, at a level of the order of hc=5*10 –24(Hamilton, Pr. of the 2nd E. Amaldi1997) • Limit for signals in the GC, using 95 days of Explorer data hc=3*10 –24(ROG+Frasca+ Papa, subm toPRD, 2001)
Continuous wave analysis Sofar we have done random search of the parameter space for 1 million points. We choose a threshold for SNR of 6.6. We have obtained 123 thr. crossing. Each event is verified by two matched filters with the parameters of the event. See the Krolak’ s talk at the GR16 • Overall sky search (2 days,Df=0.8Hz) of data is now running and will end by the summer: the analysis will put limits at the level of hc=3*10 –23 (the procedure is in Astone, Borkowsky, Jaranowsky, Krolak, gr-qc/0012108 subm. to PRD,2001) • Incoherent analysis over 1 year of data of Explorer 1991 (Astone,Krolak,Rog coll:”A fast search for continuous g.w. signals”…we are writing the paper • Extend the analysis to 1997-2000 data We will use the Rome strategy for the pulsar search, developped for Virgo (Frasca,Palomba,Ricci and the ROG collaboration)
Use of the NAUTILUS data at 935 Hz to search for the neutron star in the SN1987A Sh=(6 10-23/sqrt(Hz))2 tobs=1 year h0=sqrt(2 Sh / t_obs)=1.5 10-26 AURIGA Phase I or Phase II with the bar at 935: Sh=6-2 10-22/sqrt(Hz) h0=sqrt(2 Sh / t_obs)=( 15 – 5 ) 10-26 The signal : P=2.14 ms, dP/dt=2 10-10 Hz/s The estimation of oblateness is order of 10-6 h of order 10-26 (Middleditch et al., New Astronomy, 5, 243, 2000)
A new activity Spherical detectors a sphere has 5 modes of vibration interacting strongly with a g.w. Each mode can act as a separate antenna, oriented towards a different polarization or direction
SMALL SPHERICAL DETECTORS in preparation Mini GRAIL Material=Cu Al Diameter=65 cm Mass=1 ton Frequency=3 kHz Brazil: Mario Shenberg The Netherlands: Mini GRAIL Italy: Sfera
Gravitational waves are a tool for astronomical observations “they can reveal features of their sources which no one could ever learn by electromagnetic or neutrino studies” Kip Thorne
The Nautilus g.w. detector andthe interaction with cosmic rays • Thermo-acustical model of interaction of cosmic rays with a bar detector (Liu-Barish, De Rujula, Cabibbo, Amaldi-Pizzella) • “Expected” result for low-amplitude signals October 98-Jan 99 (Phys. Rev Lett. 84, Jan 2000) • “Unexpected” result for high-amplitude signals (Phys. Lett. B 499, Jan 2001)
E = 57.89 K. 87 TeV. The biggest event observed has E=58 K (the energy released in the bar is 87 TeV) Unfiltered signal (V2) The signal after the filtering (kelvin) The value of the merit factor, estimated from the signal, is Q = 1.7 105.
The problem is very interesting, as it involves: gravitational waves, cosmic rays, particle detection, low temperature physics Refer to the talk of F. Ronga at this meeting • Analysis of the data obtained with NAUTILUS at 1 K • 2) Cosmic ray detectors will be installed around Explorer 3)Cosmic ray detectors have been put around Niobe (different superconducting material)
CONCLUSIONS We have many interesting improvements and analyses to do The collaboration within the entire g.w. community is essential for the exploration of this new frontier of kwnoledge
Dato il tasso di aspettazione di EAS al livello del mare [5]: ( = noparicelle cariche/m2) 1 energia media attesa per un evento con molteplicità maggiore di M E energia media misurata [5]G. Cocconi, Encyclopedia of Physics Vol.46 p.228 (Publisher, City, 1961)
Sensitivity to continuous waves Ground based detectors and Pulsar Sources hc 1 year 1 year hc= sqrt(Sh/t_obs) if the source is known
The detector sensitivity to the various signals: • Burst h:Sh, Df ; matched filters ; coincidences between 2 or more detectors • Continuous sources hc:Sh, t_obs ; only one detector; Fourier analysis, pattern tracking • Stochastic background W_gw: Sh1, Sh2(h),Df , t_obs ; crosscorr.2 or more detectors
A rotating neutron star: It will emit g.w. if the mass distribution is non axis-simmetric along the rotation axis. About 109NEUTRON STARS are expected to exist in the Galaxy, but only ~ 1000have been detected, most as PULSARS.
The expected AURIGA strain sensitivity h=1 10-20(burst) Sh=(1 10-22/sqrt(Hz))2 B=50 Hz
ALLEGRO: It has been relocated and will be again on the air in a few weeks. Next: It will be equipped with a new transducer and with a new SQUID amplifier. The expected bandwidth is 50 Hz, and the expected gain in strain sensitivity a factor of 10 ( 1 *10-22/sqrt(Hz) ) NEWS on the detectors AURIGA: A new readout (new capacitive tranducer and new SQUID) is being tested. The system will be operative after the summer The expected bandwidth is 50 Hz and the expected gain in strain sensitivity is a factor 4 ( 1*10-22/sqrt(Hz) ) Explorer : the tranducer and the SQUID have been replaced . Now the bandwidth is 50 Hz @ 5*10-21 /sqrt(Hz); Next year: increase the Q of the transducer to increase the strain sensitivity. Install cosmic ray detectors around the bar NAUTILUS: after the summer the bar will be replaced and the new system will work at 935 Hz; A new transducer and SQUID (the same used for Explorer) will be used (to increase bandwidth and sensitivity) Niobe: it has been cooled down again in Feb. 2001. The readout system has been improved, to increase the sensitivity The antenna has been equipped with cosmic ray detectors
0.1 is obtained using LIGO I (h(f)=10-22 1/sqrt(Hz) at 1kHz ) the present ALLEGRO (h(f)=2*10-21 1/sqrt(Hz)) 1 year (analysis done at pieces of 2-3 months) and a bandwodth of 1 Hz 3*10-4 is obtained using LIGO II (h(f)=10-23 1/sqrt(Hz) at 1kHz) Improved ALLEGRO h(f)=10-22 1/sqrt(Hz) 1 year (analysis done at pieces of 2-3 months) and a bandwodth of 50 Hz W=0.1 can be obtained using LIGO I (h(f)=10-22 1/sqrt(Hz) at 1kHz ) the present ALLEGRO (h(f)=2*10-21 1/sqrt(Hz)) 1 year (analysis done with periods of 2-3 months) and a bandwidth of 1 Hz W=3*10-4 is obtained using LIGO II (h(f)=10-23 1/sqrt(Hz) at 1kHz) Improved ALLEGRO h(f)=10-22 1/sqrt(Hz) 1 year (analysis done with periods of 2-3 months) and a bandwidth of 50 Hz