Download
1 / 27
270 likes | 276 Views
Learn about results synthesis, a collaborative interpretation process that transforms individual raw data fragments from heuristic evaluation into concise problem descriptions, severity levels, and solutions. Understand its benefits, problems, and when and how it is used. Examples and in-class exercises included.

E N D
Results Synthesis Developed by: Donald A. Cox and Saul Greenberg Helen He, CPSC681, 10/29/07
Overview • What is it? • Why do we need it? • When is it used? • Who is involved? • How does it work? Helen He, CPSC681, 10/29/07
Overview (cont…) • Example Final Report • Benefits of RS • Problems of RS • Similar method: Affinity Diagrams • In-class Exercise • Questions? Helen He, CPSC681, 10/29/07
What is it? • A collaborative interpretation process • Input: Individual raw data fragments from heuristic evaluation • Output: An unified collection of concise problem descriptions, severity and solutions Helen He, CPSC681, 10/29/07
Why do we need it? • Information fragments -- limited use. • Interpreted fragments – more useful. • Discover root causes of problems • Concise, textual description of problems, severity and solutions Helen He, CPSC681, 10/29/07
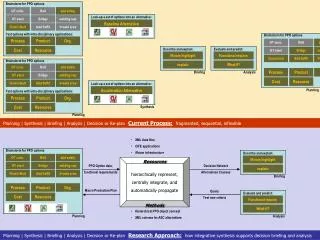
When is it used? 1. Heuristic evaluation | 2. Results Synthesis | 3. Communicate results to developers Helen He, CPSC681, 10/29/07
Who is involved? • Ideally, everyone! • Original evaluators (of heuristic evaluation) • Developers • End users • Documentation specialists, etc. Helen He, CPSC681, 10/29/07
Who is involved? (cont..) • Best results if people have been involved from the beginning! Helen He, CPSC681, 10/29/07
How it works • Spatial workspace (wall or table) • Steps: • 1. Familiarize • Spread out all problems. • 2. Initial grouping • Group by heuristic • 3. Review • Review and discuss entire dataset. Initial interpretation. Helen He, CPSC681, 10/29/07
Step 4: Emergence (1) • “Ideas do not arise well informed. At first there are expressions of fragmentsof thoughts. Once there is some rough material to work with, interpretations gradually begin to emergeas they are discussed.” • (Moran, Chiu, and van Melle, 1997, p.46) Helen He, CPSC681, 10/29/07
Step 4: Emergence (1 cont..) • What is it? • Extended consideration to find root causes • Existing connections and new abstractions • Iteratively re-organize and re-group • Problems get moved to new groups or labels. Duplicates found. • New understanding of problems. Helen He, CPSC681, 10/29/07
Step 4: Emergence (2 cont..) • Emergence is best supported through a spatial medium! • Wall or table • Annotation of workspace: • Spatial proximity • Tracks progress • Completed and To do Helen He, CPSC681, 10/29/07
Step 4: Emergence (3) • Final work surface: • consensus reached about groups • Next step: • Put rich interpretation into final report Helen He, CPSC681, 10/29/07
Final step: Interpretation • Deliverables: • Problem description • Why is it a problem? (users and their tasks) • How to reproduce it? • Severity • Who does it affect? How severe? • Recommended solution • May include alternate solutions Helen He, CPSC681, 10/29/07
Example: Final Report • Raw data (from heuristic evaluation): • 1. (good error messages) • “Unknown map coordinates” is not precise. • Should repeat user’s input and give different error messages depending on error • 2. (prevent errors) • More forgiving in longitudes and latitudes. • 3. (simple and natural dialog) • Magnification factor is obscure. Unsure what it means. Zoom slider better. • 4. (simple and natural dialog) • Navigation about map is awkward. Coords and zoom box are confusing. Use zoom slider instead. • 5. (speak user’s language) • Not comfortable using coords. Allow user to click and zoom in. Helen He, CPSC681, 10/29/07
Example: Final Report (cont..) • Insights: • From different heuristics, but problems are related. • Root cause of problems – navigation in map. • 1,2,3 are caused by awkward navigation. • 4,5 are duplicate solutions to problems 1,2,3. • Can becombinedintoone problem! Helen He, CPSC681, 10/29/07
Example: Final Report (cont..) • Problem description #1: • Centering and zooming into the map is awkward as users will not be knowledgeable about what longitude and latitude coordinates to use in defining the map center and do not know what to use as the appropriate magnification factor to get the desired zoom. • Severity: • As this is a fundamental and frequent task that all users will be expected to perform, this problem is a usability catastrophe (Scale: 4). • Recommended course of action: • Remove the groupbox “Zoom specifications” including the textboxes for “Map Center” and “Magnification”. Instead, allow users to both center and zoom into the map by a constant amount by double-clicking with the left-mouse button directly on the area of the map they wish to center and zoom into. Helen He, CPSC681, 10/29/07
Overview • Benefits • Problems • Materials required • In-class Exercise • Output: • Examples • Questions? Helen He, CPSC681, 10/29/07
Benefits • Natural and intuitive process • Involvement • Usability issues • Deeper understanding of interface, target users and their tasks • Team interaction • Usability in a positive light • Rootcauses rather than symptoms Helen He, CPSC681, 10/29/07
Problems • Expertise of participants Final report • Raw data Output • Most productive with more involved: • May be expensive or impossible to get everyone involved • Emergence == insight! • Requires a period of time Helen He, CPSC681, 10/29/07
Similar Methods: Affinity Diagrams • (DEF) Affinity: a natural attraction or feeling of kinship (wordnet.princeton.edu/perl/webwn) • What is it? • Hierarchy of common structure and themes from individual notes • How? • Built bottom-up • NO predefined structure or set of categories • Post-Its and Labels reveal new insights • Team consensus, discussion Helen He, CPSC681, 10/29/07
Similar Methods: Affinity Diagrams (cont..) • “The basic process is to put up one note. There’s no need to justify why they go together – just as you can feel an affinity for a friend without justifying why.” • (“Contextual Design”, p.156) Helen He, CPSC681, 10/29/07
In-Class Exercise • Input: • Raw data from heuristic evaluation • Output: • Final problem reports Helen He, CPSC681, 10/29/07
In-Class Exercise (cont..) • Materials: • Wall, pen, markers • Index cards, tape • Limitationsof this exercise! • 2 groups • 3 heuristic raw problems/person • 20 minutes • Helen will take photos of progress! Helen He, CPSC681, 10/29/07
Questions? Thank you for your attention! Helen He, CPSC681, 10/29/07