Download
1 / 69
710 likes | 775 Views
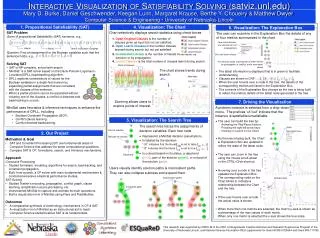
Computer-based visualization systems enhance human capabilities by providing visual representations of datasets for effective analysis. This talk explores the importance of human involvement, external representations, and resource limitations in visualization design. It also delves into the significance of analytical frameworks in designing innovative visualization solutions.

E N D
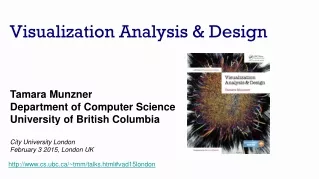
Visualization Analysis & Design • Tamara Munzner • Department of Computer Science • University of British Columbia • City University London • February 3 2015, London UK http://www.cs.ubc.ca/~tmm/talks.html#vad15london
Defining visualization (vis) Computer-based visualization systems provide visual representations of datasets designed to help people carry out tasks more effectively. Why?...
Why have a human in the loop? • don’t need vis when fully automatic solution exists and is trusted • many analysis problems ill-specified • don’t know exactly what questions to ask in advance • possibilities • long-term use for end users (e.g. exploratory analysis of scientific data) • presentation of known results • stepping stone to better understanding of requirements before developing models • help developers of automatic solution refine/debug, determine parameters • help end users of automatic solutions verify, build trust Computer-based visualization systems provide visual representations of datasets designed to help people carry out tasks more effectively. Visualization is suitable when there is a need to augment human capabilities rather than replace people with computational decision-making methods. 3
Why use an external representation? • external representation: replace cognition with perception Computer-based visualization systems provide visual representations of datasets designed to help people carry out tasks more effectively. [Cerebral: Visualizing Multiple Experimental Conditions on a Graph with Biological Context. Barsky, Munzner, Gardy, and Kincaid. IEEE TVCG (Proc. InfoVis) 14(6):1253-1260, 2008.] 4
Why have a computer in the loop? • beyond human patience: scale to large datasets, support interactivity • consider: what aspects of hand-drawn diagrams are important? Computer-based visualization systems provide visual representations of datasets designed to help people carry out tasks more effectively. [Cerebral: a Cytoscape plugin for layout of and interaction with biological networks using subcellular localization annotation. Barsky, Gardy, Hancock, and Munzner. Bioinformatics 23(8):1040-1042, 2007.]
Why depend on vision? • human visual system is high-bandwidth channel to brain • overview possible due to background processing • subjective experience of seeing everything simultaneously • significant processing occurs in parallel and pre-attentively • sound: lower bandwidth and different semantics • overview not supported • subjective experience of sequential stream • touch/haptics: impoverished record/replay capacity • only very low-bandwidth communication thus far • taste, smell: no viable record/replay devices Computer-based visualization systems provide visual representations of datasets designed to help people carry out tasks more effectively. 6
Why show the data in detail? • summaries lose information • confirm expected and find unexpected patterns • assess validity of statistical model • Anscombe’s Quartet 7
Why focus on tasks and effectiveness? • tasks serve as constraint on design (as does data) • representations do not serve all tasks equally! • challenge: recast tasks from domain-specific vocabulary to abstract forms • most possibilities ineffective • validation is necessary, but tricky • increases chance of finding good solutions if you understand full space of possibilities • what counts as effective? • novel: enable entirely new kinds of analysis • faster: speed up existing workflows Computer-based visualization systems provide visual representations of datasets designed to help people carry out tasks more effectively. 8
Why are there resource limitations? • computational limits • processing time • system memory • human limits • human attention and memory • display limits • pixels are precious resource, the most constrained resource • information density: ratio of space used to encode info vs unused whitespace • tradeoff between clutter and wasting space, find sweet spot between dense and sparse Vis designers must take into account three very different kinds of resource limitations: those of computers, of humans, and of displays. 9
TreeJuxtaposer Why analyze? SpaceTree [SpaceTree: Supporting Exploration in Large Node Link Tree, Design Evolution and Empirical Evaluation. Grosjean, Plaisant, and Bederson. Proc. InfoVis 2002, p 57–64.] [TreeJuxtaposer: Scalable Tree Comparison Using Focus+Context With Guaranteed Visibility. ACM Trans. on Graphics (Proc. SIGGRAPH) 22:453– 462, 2003.] • imposes a structure on huge design space • scaffold to help you think systematically about choices • analyzing existing as stepping stone to designing new
Analysis framework: Four levels, three questions domain domain abstraction abstraction idiom algorithm idiom algorithm • domain situation • who are the target users? • abstraction • translate from specifics of domain to vocabulary of vis • what is shown? data abstraction • why is the user looking at it? task abstraction • idiom • how is it shown? • visual encoding idiom: how to draw • interaction idiom: how to manipulate • algorithm • efficient computation [A Nested Model of Visualization Design and Validation. Munzner. IEEE TVCG 15(6):921-928, 2009 (Proc. InfoVis 2009). ] [A Multi-Level Typology of Abstract Visualization Tasks Brehmer and Munzner. IEEE TVCG 19(12):2376-2385, 2013 (Proc. InfoVis 2013). ]
{action, target} pairs • discover distribution • compare trends • locate outliers • browse topology
Actions, high-level: Analyze • consume • discover vs present • classic split • aka explore vs explain • enjoy • newcomer • aka casual, social • produce • annotate, record • derive • crucial design choice
Actions: Mid-level search, low-level query • what does user know? • target, location • how much of the data matters? • one, some, all
+ 1 previous How to handle complexity: 3 more strategies
Encoding visually • analyze idiom structure 21
Definitions: Marks and channels • marks • geometric primitives • channels • control appearance of marks
1: vertical position 4: vertical position horizontal position color hue size (area) 3: vertical position horizontal position color hue 2: vertical position horizontal position Encoding visually with marks and channels mark: line mark: point mark: point mark: point • analyze idiom structure • as combination of marks and channels 23
Channels: Rankings • effectiveness principle • encode most important attributes with highest ranked channels • expressiveness principle • match channel and data characteristics
Accuracy: Vis experiments [Crowdsourcing Graphical Perception: Using Mechanical Turk to Assess Visualization Design. Heer and Bostock. Proc ACM Conf. Human Factors in Computing Systems (CHI) 2010, p. 203–212.] after Michael McGuffin course slides, http://profs.etsmtl.ca/mmcguffin/
Idioms: dot chart, linechart • one key, one value • data • 2 quant attribs • mark: points • dot plot: + line connection marks between them • channels • aligned lengths to express quant value • separated and ordered by key attrib into horizontal regions • task • find trend • connection marks emphasize ordering of items along key axis by explicitly showing relationship between one item and the next
Idiom: glyphmaps • rectilinear good for linear vs nonlinear trends • radial good for cyclic patterns [Glyph-maps for Visually Exploring Temporal Patterns in Climate Data and Models. Wickham, Hofmann, Wickham, and Cook. Environmetrics 23:5 (2012), 382–393.]
Idiom: heatmap • two keys, one value • data • 2 categ attribs (gene, experimental condition) • 1 quant attrib (expression levels) • marks: area • separate and align in 2D matrix • indexed by 2 categorical attributes • channels • color by quant attrib • (ordered diverging colormap) • task • find clusters, outliers • scalability • 1M items, 100s of categ levels, ~10 quant attrib levels 32
Idiom: cluster heatmap • in addition • derived data • 2 cluster hierarchies • dendrogram • parent-child relationships in tree with connection line marks • leaves aligned so interior branch heights easy to compare • heatmap • marks (re-)ordered by cluster hierarchy traversal 33
Idiom: choropleth map • use given spatial data • when central task is understanding spatial relationships • data • geographic geometry • table with 1 quant attribute per region • encoding • use given geometry for area mark boundaries • sequential segmented colormap http://bl.ocks.org/mbostock/4060606
Idiom: topographic map • data • geographic geometry • scalar spatial field • 1 quant attribute per grid cell • derived data • isoline geometry • isocontours computed for specific levels of scalar values Land Information New Zealand Data Service
Idioms: isosurfaces, direct volume rendering • data • scalar spatial field • 1 quant attribute per grid cell • task • shape understanding, spatial relationships • isosurface • derived data: isocontours computed for specific levels of scalar values • direct volume rendering • transfer function maps scalar values to color, opacity • no derived geometry [Interactive Volume Rendering Techniques. Kniss. Master’s thesis, University of Utah Computer Science, 2002.] [Multidimensional Transfer Functions for Volume Rendering. Kniss, Kindlmann, and Hansen. In The Visualization Handbook, edited by Charles Hansen and Christopher Johnson, pp. 189–210. Elsevier, 2005.]
Idioms: vector glyphs • tasks • finding critical points, identifying their types • identifying what type of critical point is at a specific location • predicting where a particle starting at a specified point will end up (advection) [Comparing 2D vector field visualization methods: A user study. Laidlaw et al. IEEE Trans. Visualization and Computer Graphics (TVCG) 11:1 (2005), 59–70.] [Topology tracking for the visualization of time-dependent two-dimensional flows. Tricoche, Wischgoll, Scheuermann, and Hagen. Computers & Graphics 26:2 (2002), 249–257.] 38
Idiom: similarity-clustered streamlines • data • 3D vector field • derived data (from field) • streamlines: trajectory particle will follow • derived data (per streamline) • curvature, torsion, tortuosity • signature: complex weighted combination • compute cluster hierarchy across all signatures • encode: color and opacity by cluster • tasks • find features, query shape • scalability • millions of samples, hundreds of streamlines [Similarity Measures for Enhancing Interactive Streamline Seeding. McLoughlin,. Jones, Laramee, Malki, Masters, and. Hansen. IEEE Trans. Visualization and Computer Graphics 19:8 (2013), 1342–1353.] 39
Idiom: force-directed placement • visual encoding • link connection marks, node point marks • considerations • spatial position: no meaning directly encoded • left free to minimize crossings • proximity semantics? • sometimes meaningful • sometimes arbitrary, artifact of layout algorithm • tension with length • long edges more visually salient than short • tasks • explore topology; locate paths, clusters • scalability • node/edge density E < 4N http://mbostock.github.com/d3/ex/force.html
Idiom: adjacency matrix view • data: network • transform into same data/encoding as heatmap • derived data: table from network • 1 quant attrib • weighted edge between nodes • 2 categ attribs: node list x 2 • visual encoding • cell shows presence/absence of edge • scalability • 1K nodes, 1M edges [NodeTrix: a Hybrid Visualization of Social Networks. Henry, Fekete, and McGuffin. IEEE TVCG (Proc. InfoVis) 13(6):1302-1309, 2007.] [Points of view: Networks. Gehlenborg and Wong. Nature Methods 9:115.] 42
Connection vs. adjacency comparison • adjacency matrix strengths • predictability, scalability, supports reordering • some topology tasks trainable • node-link diagram strengths • topology understanding, path tracing • intuitive, no training needed • empirical study • node-link best for small networks • matrix best for large networks • if tasks don’t involve topological structure! http://www.michaelmcguffin.com/courses/vis/patternsInAdjacencyMatrix.png [On the readability of graphs using node-link and matrix-based representations: a controlled experiment and statistical analysis. Ghoniem, Fekete, and Castagliola. Information Visualization 4:2 (2005), 114–135.] 43
Idiom: radial node-link tree • data • tree • encoding • link connection marks • point node marks • radial axis orientation • angular proximity: siblings • distance from center: depth in tree • tasks • understanding topology, following paths • scalability • 1K - 10K nodes http://mbostock.github.com/d3/ex/tree.html 44
Idiom: treemap • data • tree • 1 quant attrib at leaf nodes • encoding • area containment marks for hierarchical structure • rectilinear orientation • size encodes quant attrib • tasks • query attribute at leaf nodes • scalability • 1M leaf nodes http://tulip.labri.fr/Documentation/3_7/userHandbook/html/ch06.html 45
Connection vs. containment comparison • marks as links (vs. nodes) • common case in network drawing • 1D case: connection • ex: all node-link diagrams • emphasizes topology, path tracing • networks and trees • 2D case: containment • ex: all treemap variants • emphasizes attribute values at leaves (size coding) • only trees [Elastic Hierarchies: Combining Treemaps and Node-Link Diagrams. Dong, McGuffin, and Chignell. Proc. InfoVis 2005, p. 57-64.]
Color: Luminance, saturation, hue • 3 channels • identity for categorical • hue • magnitude for ordered • luminance • saturation • better match for visual encoding than RGB color space from graphics 48
Categorical color: Discriminability constraints • noncontiguous small regions of color: only 6-12 bins [Cinteny: flexible analysis and visualization of synteny and genome rearrangements in multiple organisms. Sinha and Meller. BMC Bioinformatics, 8:82, 2007.]
+ 1 previous How to handle complexity: 3 more strategies • change over time • most obvious & flexible of the 4 strategies