Download

1 / 16
260 likes | 334 Views
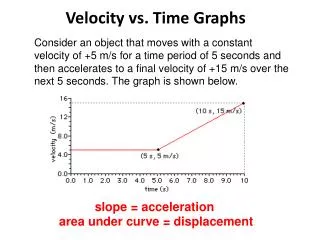
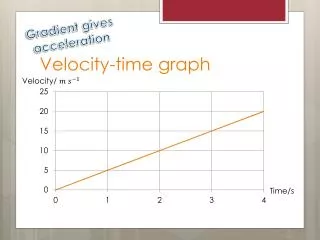
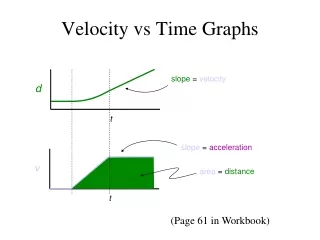
Velocity-Time Graphs. Velocity-time Graphs. Uniform accelerated motion is a motion with the constant acceleration (a – const) Slope (gradient) of the velocity –time graph v(t) = acceleration

E N D
Velocity-Time Graphs www.assignmentpoint.com
Velocity-time Graphs • Uniform accelerated motion is a motionwith the constant acceleration (a – const) • Slope (gradient) of the velocity –time graph v(t) = acceleration • The steeper the line of the graph v(t) the greater the acceleration of the body v(m/s) 1 2 3 t(s) a1 > a2 > a3 www.assignmentpoint.com
Accelerated Motion www.assignmentpoint.com
Slope of Distance-Time Graphs • Motion is described by the equation d = vt • The slope (gradient) of the DT graph = Velocity • The steeper the line of a DT graph,the greater the velocity of the body 1 d(m) 2 3 v1 > v2 > v3 t(s) www.assignmentpoint.com
d B A t C 1 – D Motion Graphing Negative Displacement A … Starts at home (origin) and goes forward slowly B … Not moving (position remains constant as time progresses) C … Turns around and goes in the other direction quickly, passing up home www.assignmentpoint.com
d Tangent Lines show velocity t On a position vs. time graph: www.assignmentpoint.com
d t Increasing & Decreasing Displacement Increasing Decreasing On a position vs. time graph: Increasing means moving forward (positive direction). Decreasing means moving backwards (negative direction). www.assignmentpoint.com
d t Concavity shows acceleration On a position vs. time graph: Concave up means positive acceleration. Concave down means negative acceleration. www.assignmentpoint.com
d t Special Points Q R P S www.assignmentpoint.com
d t Curve Summary B C A D www.assignmentpoint.com
d t All 3 Graphs v t a t www.assignmentpoint.com
d t v t Graphing Tips • Line up the graphs vertically. • Draw vertical dashed lines at special points except intercepts. • Map the slopes of the position graph onto the velocity graph. • A red peak or valley means a blue time intercept. www.assignmentpoint.com
v t a t Graphing Tips The same rules apply in making an acceleration graph from a velocity graph. Just graph the slopes! Note: a positive constant slope in blue means a positive constant green segment. The steeper the blue slope, the farther the green segment is from the time axis. www.assignmentpoint.com
v t a t Real life Note how the v graph is pointy and the a graph skips. In real life, the blue points would be smooth curves and the green segments would be connected. In our class, however, we’ll mainly deal with constant acceleration. www.assignmentpoint.com
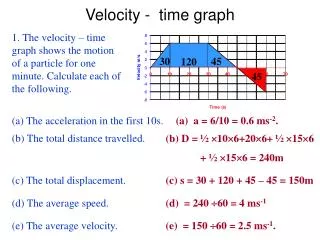
v t Area under a velocity graph “forward area” “backward area” Area above the time axis = forward (positive) displacement. Area below the time axis = backward (negative) displacement. Net area (above - below) = net displacement. Total area (above + below) = total distance traveled. www.assignmentpoint.com
“forward area” v t “backward area” d t Area The areas above and below are about equal, so even though a significant distance may have been covered, the displacement is about zero, meaning the stopping point was near the starting point. The position graph shows this too. www.assignmentpoint.com