Download
1 / 5
60 likes | 288 Views
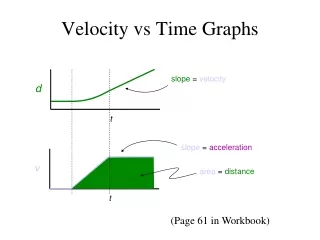
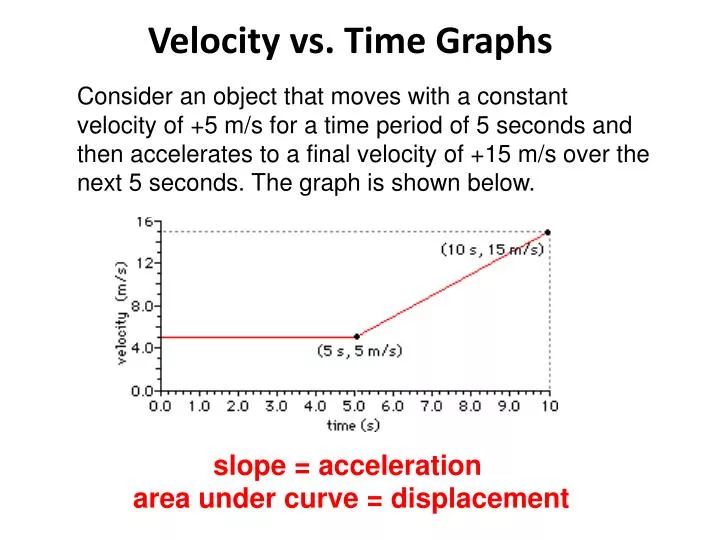
Velocity vs. T ime Graphs. Consider an object that moves with a constant velocity of +5 m/s for a time period of 5 seconds and then accelerates to a final velocity of +15 m/s over the next 5 seconds. The graph is shown below . slope = acceleration area under curve = displacement.

E N D
Velocity vs. Time Graphs Consider an object that moves with a constant velocity of +5 m/s for a time period of 5 seconds and then accelerates to a final velocity of +15 m/s over the next 5 seconds. The graph is shown below. slope = acceleration area under curve = displacement
Determining the Area on a v-t Graph • Rennata Gas is driving through town at 25.0 m/s and begins to accelerate at a constant rate of -1.0 m/s2. Eventually Rennata comes to a complete stop. • Represent Rennata's accelerated motion by sketching a velocity-time graph. Use the velocity-time graph to determine this distance. • 2. Use kinematic equations to calculate the distance that Rennata travels while decelerating Area = 0.5*b*h = 0.5*(25.0 s)*(25.0 m/s) Area = 313 m vf2= vi2 + 2*a*d (0 m/s)2 = (25.0 m/s)2 + 2 * (-1.0 m/s2)*d 0.0 m2/s2 = 625.0 m2/s2 + (-2.0 m/s2)*d 0.0 m2/s2 - 625.0 m2/s2 = (-2.0 m/s2)*d (-625.0 m2/s2)/(-2.0 m/s2) =d 313 m = d
Determining the Area on a v-t Graph Earl E. Bird travels 30.0 m/s for 10.0 seconds. He then accelerates at 3.00 m/s2 for 5.00 seconds. Construct a velocity-time graph for Earl E. Bird's motion. Use the plot to determine the total distance traveled. • The velocity-time graph for the motion is: The distance traveled can be found by a calculation of the area between the line on the graph and the time axis. This area would be the area of the triangle plus the area of rectangle 1 plus the area of rectangle 2. Area = 0.5*btri*htri + b1*h1 + b2*h2 Area = 0.5*(5.0 s)*(15.0 m/s) + (10.0 s)*(30.0 m/s) + (5.0 s)*(30.0 m/s) Area = 37.5 m + 300 m + 150 m Area = 488 m