Download
1 / 39
450 likes | 1.46k Views
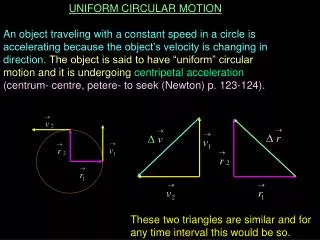
VELOCITY-TIME GRAPHS: UNIFORM AND NON-UNIFORM MOTION. KINEMATICS: Lesson 3. The shape of the velocity-time graph reveals whether the object is at rest, moving at constant speed, speeding up, or slowing down. DATA TABLE. Suppose an airplane has a cruising altitude of

E N D
VELOCITY-TIME GRAPHS: UNIFORM AND NON-UNIFORM MOTION • KINEMATICS: Lesson 3
The shape of the velocity-time graph reveals whether the object is at rest, moving at constant speed, speeding up, or slowing down.
DATA TABLE Suppose an airplane has a cruising altitude of 10 600 m and travels at a constant velocity of 900 km/h [E] for 5.0 h.
1. SLOPE OF A VELOCITY-TIME GRAPH • Just as the slope of a position-time graph reveals the rate at which position changes (velocity), the slope of a velocity-time graph reveals the rate at which velocity changes (acceleration).
SLOPES OF VELOCITY-TIME GRAPHS The slope of a velocity-time graph represents the acceleration of the object.
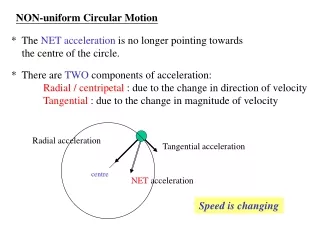
Non-uniform Motion – riding a quad Velocity is not constant.
a. Definition of ACCELERATION • An object whose velocity changes (in this case, increases) over a time interval is undergoing acceleration, represented by the variable a. • Acceleration is a vector quantity. • It is also called non-uniform motion because the object’s speed or directionis changing. • When velocity decreases it is undergoing negative acceleration, also represented by the variable a.
Let’s determine the slope of the plane’s velocity time graph. Designate east as the positive direction:
Notice the units of the slope of the velocity-time graph: km/h2. • These units are units of acceleration. • Because the plane is moving at a constant velocity, its acceleration is zero.
In general, you can recognize acceleration values by their units. • In physics, the standard units for acceleration are metres per second per second, which is generally abbreviated to m/s2. (read metres per second squared).
b. NEGATIVE ACCELERATION • What is the meaning of negative acceleration? • When interpreting the sign of acceleration, you need to compare it to the sign of velocity. • When the directions (signs) of velocity and acceleration are the same (positive or negative), the object is speeding up. • When velocity and acceleration have opposite directions (signs), the object slows down.
2. AREA UNDER A VELOCITY-TIME GRAPH • The area under a velocity-time graph represents the objects displacement. Unit analysis indicates that the area under a velocity-time graph equals displacement. Multiplying l x w of each rectangle gives us For eastward displacement, the area is above the time axis, so it is positive. For westward displacement, the area is below the time axis, so it is negative.
To calculate displacement we must find the sum of the three areas (A, B and C) under the velocity-time graph. • Designate east as the positive direction (above the horizontal axis) . • Convert minutes to seconds. • Let’s do this together!
b. To find acceleration, find the slope of each section of the graph. Region C is a horizontal line so its slope is also zero.
3. AVERAGE VELOCITY ON A VELOCITY – TIME GRAPH • To calculate average velocity, determine the area under the velocity-time graph and divide it by the total time. • To find the average velocity given different displacements over different time intervals, • add the total displacement and divide by the total time.
EXAMPLE 1.8 A bird starts flying south. Its motion is described in the velocity-time graph in Figure 1.46. From the graph, determine: (a) whether acceleration is positive, negative, or zero for each section (b) when the bird changes direction.
Acceleration is the slope of each section of the graph. • A: Negative • Final velocity is more negative than the initial velocity, as the bird is speeding up in the south direction. So the slope of this line is negative. The bird’s acceleration is negative. • B: Zero • Acceleration is zero because the slope is zero (the graph is a horizontal line.) • C: Negative • Acceleration is negative because the slope of the line is negative (as in section A). • D: Zero • Acceleration is zero because the slope of the line is zero (as in section B). • E: Positive • Final velocity is positive because the bird is now flying north. So the slope of this line is positive. The bird’s acceleration is positive. • F: Zero • Acceleration is zero because the slope of the line is zero.
4. INSTANTANEOUS VELOCITY • Instantaneous velocity is the velocity of an object taken at a specific time, an instant. • Earlier in this section we learned that to determine the velocity of an object from a position-time graph you calculate the slope of the graph. • How can you obtain the slope of a curve?
INSTANTANEOUS VELOCITY • To determine the velocity (and therefore slope) of an object at any instant, physicists use tangents. • A tangent is a straight line that touches a curve at only one point.
Each tangent on a curve has a unique slope, which represents the velocity at that instant. • In order for the object to be at that position, at that time, it must have an instantaneous velocity equal to the slope of the tangent at that point.
You can now create a new table using the slopes of the position-time graphs. This velocity-time graph represents an object undergoing uniformly accelerated motion.
SLOPE OF A VELOCITY-TIME GRAPH An acceleration-time graph for an object undergoing uniformly accelerated motion is straight line with zero slope.
EXAMPLE 1.5 • This ATV is undergoing non-uniform motion. It is accelerating, in this case, slowing down. • What would the position-time graph look like? • What would the velocity-time graph look like? • What would the acceleration-time graph look like?
The acceleration of the ATV is 2.8 m/s2. Because the forward direction was designated as positive, the negative sign means that the direction of acceleration is backward.
SUMMARY • Velocity-time graphs are very useful. They provide the following information: • The velocity-time graph gives you instantaneous velocity values at given times. • Calculating the slope of a velocity-time graph gives you an object’s acceleration. • The area under a velocity-time graph gives you the object’s displacement. • You can determine the average velocity of an object over a time interval from a velocity-time graph.
Homework from Textbook: • Check and Reflect • Page 30: Q # 1 – 4 • Practice Problems