Download
1 / 30
300 likes | 378 Views
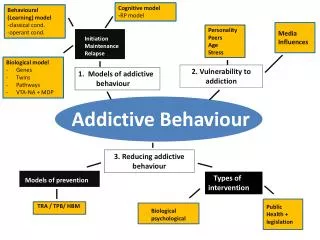
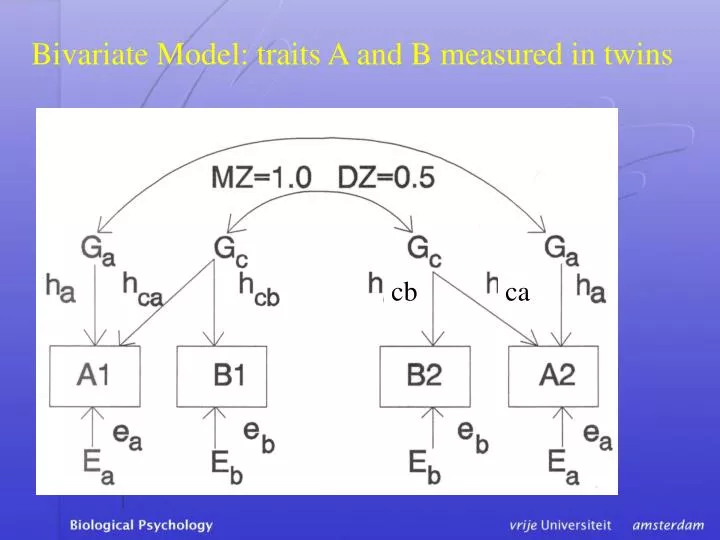
Bivariate Model: traits A and B measured in twins. cb. ca. Questions. Do the genes that influence trait B also influence trait A? Are there genes that are unique to trait A? Is the phenotypic correlation caused by genetic correlation?

E N D
Questions • Do the genes that influence trait B also influence trait A? • Are there genes that are unique to trait A? • Is the phenotypic correlation caused by genetic correlation? • What is the genetic correlation? (ie the genetic covariance /genetic SD(A)*genetic SD(B) • The same questions apply to environmental (shared and uqniue) influences.
cb ca What is the variance for traits A and B? What is the covariance between A and B? What are the MZ and DZ twin covariances for A and B? What are the twin cross-covariances (A in twin 1 with B in twin 2)?
cb ca What is the variance for traits A and B? A: h2a + h2ca +e2a and B: h2cb+e2b
cb ca What is the covariance for MZ and DZ twins for traits A and B? MZ Covar(A) : h2ca + h2a andMZ Covar(B) : h2cb DZ Covar(A) : 0.5 h2ca + 0.5h2a andDZ Covar(B) : 0.5 h2cb
cb ca What is the covariance between traits A and B? Covar(A,B) : hca * hcb
cb ca What is the cross-covariance for MZ and DZ twins (A1 with B2)? MZ Covar(A1, B2) : hca * hcb DZ Covar(A1, B2) : 0.5(hca * hcb)
Kendler & Eaves (1986; see also Eaves 1982) describe 3 models for how genes and environment may jointly influence a phenotype: -Contribution of genes and environment is additive -Genes and environments are correlated: genes alter exposure to the relevant environmental factors-Genes and environment interact: Genes control sensitivity to the environment; or: the environment controls gene expression : Eaves LJ (1984) Genetic Epidemiology , 215-228 Kendler KS, Eaves LJ (1986) American J Psychiatry, 279-289
-Contribution of genes and environment is additive P = G + E (P = hG + eE) Var (P) = Var G + Var (E) (Var (P) = h2 + e2) :
Genes and environments are correlated: P = G + E Var (P) = Var (G) + Var (E) + 2 Cov (G,E)
Genotype-environment interaction I: Influences of genotype and environment on a trait can be estimated conditional on environmental exposure (e.g. mariatal status; religious upbringing, SES). *No GxE interaction: influence of genes and environment is the same for subjects with different degrees of exposure. *GxE interaction: genetic effects are modified by exposure: heritabilities differ between exposure-positive and exposure-negative groups.
Genotype-environment interaction II: Evidence for GxE interaction based on differences in heritabilities does not tell us if the same genes are expressed in different groups. To address this issue, data from twins discordant for environmental exposure are required, or longitudinal data from twins measured under different environmental conditions.
Genotype-environment interaction III: Longitudinal data available: GxE interaction can then be detected from the genetic correlation between traits. If the genetic correlation is high, then trait values in the two environments are determined by the same genes. If the genetic correlation is low, then the trait is influenced by different genes in different environments. Falconer DS (1989) Introduction to Quantitative Genetics (3rd ed.), Longman, London.
cb ca Suppose A and B are the same trait measured on the same subjects under different (experimental) conditions; e.g. depression assessed before and after Ss participated in an exercise program. How many twins would we need to measure to test if the same genes are expressed before and after exercise?
Mx exercise 1 • Simulate bivariate data in twins • Fit the correct model to the simulated data • Fit the wrong model to the data: • no genetic covariance (different genes) • genetic correlation = 1 (same genes)
Mx exercise 2 • Analyze bivariate data in twins: brain size (MRI) and IQ • Fit the model to raw data • for IQ 233 pairs • for MRI 111 pairs • in addition to data from twins there are also data from their siblings
Mx exercise 1: F:\dorret\2002 • Simulate bivariate data : bivarSimulajob • Fit the correct model: bivarTruejob • Fit the wrong model to the data: • no genetic covariance: change bivarTruejob • genetic correlation = 1: bivarConstrainjob • genetic correlation = 0: change bivarConstrainjob • NB no data file because data are simulated in the first job
Mx exercise 1: F:\dorret\2002 1) bivarTruejob: chi2 = 0 (df=11) 2) no genetic covariance: chi2 = 3.17 (df=12) 3) genetic correlation = 1: chi2 = 2.97 (df=15), power is 41% 4) genetic correlation = 0: chi2 = 3.17 (df=15), power is 42% ANALYSES 2 AND 4 GIVE THE SAME ANSWER WHY ARE THE DF DIFFERENT?
MRI-IQ dataset Phenotypic correlations Working memory – gray matter volume 0.27 Working memory – white matter volume 0.28 Posthuma et al. Nature Neuroscience, Feb 2002
MRI-IQ dataset Twin and sibling correlations (npairs) WM BBGM BBWM MZ 0.72 (102) 0.86 (54) 0.89 (54) DZ 0.27 (131) 0.45 (57) 0.34 (57) Twin1-sib 0.13 (129) 0.53 (30) 0.58 (30) Twin2-sib 0.39 (129) 0.43 (31) 0.58 (31)
MRI-IQ dataset WM = working memory BBGM = gray matter volume of the cerebrum BBWM = white matter volume of the cerebrum (Variables have already been corrected for the effects of age and sex) Mx job: MRI_IQx.mx (f:\dorrret\2002) Data file: mri3.dat (f:\dorrret\2002)
IQ-MRI • What is the genetic correlation between brain size (MRI) and IQ? • What is the correlation of common E factors? • What is the correlation of unique E factors? • What are h2 c2 ande2 ? • What determines the phenotypic correlation?
IQ-MRI • genetic correlation: 0.29 • correlation of common E factors: .99 • correlation of unique E factors: .05 MRI IQ • h2 = .65 .87 • c2 = .00 .00 • e2 = .35 .13 • What determines the phenotypic correlation?
Regular exercise psychological well-being Regular exercise psychological well-being Regular exercise psychological well-being Causality: for example the association ofregular physical exercise and depression Regular exercise psychological well-being Environment Heredity
Genetic & environmental correlation Rc Rg Ere Cre Are Epw Cpw Apw ere cre are epw cpw apw Regular Exercise Psychological Well-being Estimate Rc, Rg and path coefficients from MZ and DZ (cross) correlations
Cross-sectional approach to causality in twins If A B: r(A1, B2) = (ha rg ha ha )* i: i.e. the cross-correlation in twins Is a function of the heritability of A If BA then … Twin 1 Twin 2
A1 1 A2 ha2+j2hb21 B1 j j hb2 1 B2 j hb2 j hb21 MZ DZ A1 1 A2 .5ha2+.5j2hb2 1 B1 j .5j hb2 1 B2 .5j hb2 j .5hb2 1 Cross-sectional modeling of causality in twins A1 A2 B1 B2 A1 1 A2 ha2 1 B1 i i ha2 1 B2 i ha2 i hb2+i2ha2 1 MZ DZ A1 1 A2 .5ha2 1 B1 i .5i ha2 1 B2 .5i ha2 i .5hb2+.5i2ha2 1 Twin 1 Twin 2
Bivariate models and direction of causality. The casual model is nested under the general bivariate model; however, the issue of measurement error is a very critial one in establishing the direction of causality (or reciprocal interaction).