Download

1 / 9
90 likes | 159 Views
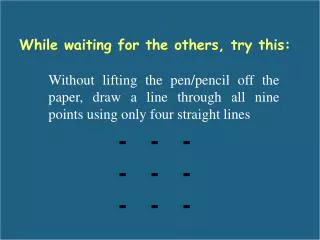
Get out the Pencil Task from Last Thursday!. April 22 nd , 2014. Probability Histograms with Curve. How did we find Probability?. What is a probability distribution?. A table or an equation that links each outcome of a statistical experiment with its probability of occurrence

E N D
Get out the Pencil Task from Last Thursday! April 22nd, 2014
What is a probability distribution? • A table or an equation that links each outcome of a statistical experiment with its probability of occurrence • The table below, which associates each outcome with its probability, is an example of a probability distribution
How do you find mean and standard deviation of a probability distribution? Mean Equation: where x = data and “mu” P(x) = probability of that data Standard Deviation Equation: where = mean “sigma”
Find the mean and standard deviation of the table below pg. 894 #11 How do you put classes in the calculator??? Use class marks!
Assignment: Work on Please be Discrete Learning Task #’s 1&2