Download
1 / 10
100 likes | 253 Views
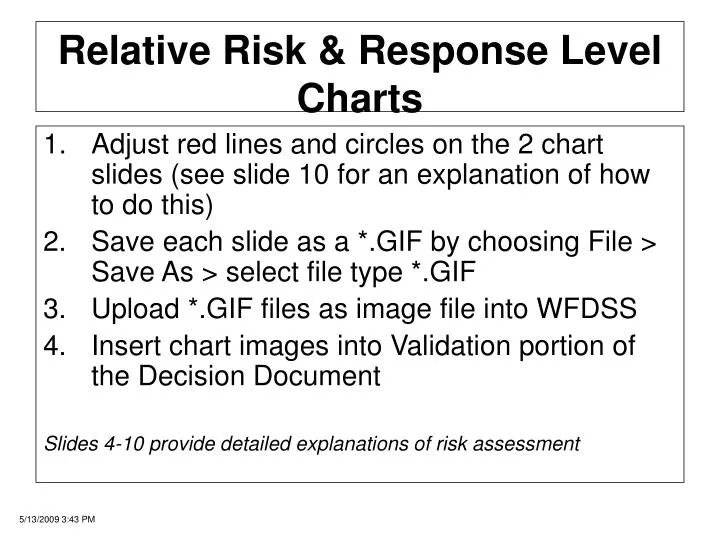
Adjust red lines and circles on the 2 chart slides (see slide 10 for an explanation of how to do this) Save each slide as a *.GIF by choosing File > Save As > select file type *.GIF Upload *.GIF files as image file into WFDSS Insert chart images into Validation portion of the Decision Document

E N D
Adjust red lines and circles on the 2 chart slides (see slide 10 for an explanation of how to do this) Save each slide as a *.GIF by choosing File > Save As > select file type *.GIF Upload *.GIF files as image file into WFDSS Insert chart images into Validation portion of the Decision Document Slides 4-10 provide detailed explanations of risk assessment Relative Risk & Response Level Charts
Incident Complexity Chart Use drawing tools to complete