Download
1 / 12
120 likes | 271 Views
x. x. . . Graph y = ,and state the domain and range. Compare the graph with the graph of y = . Make a table of values and sketch the graph. 1. 2. EXAMPLE 1. Graph a square root function. SOLUTION. x. x. . . The radicand of a square root must be nonnegative.

E N D
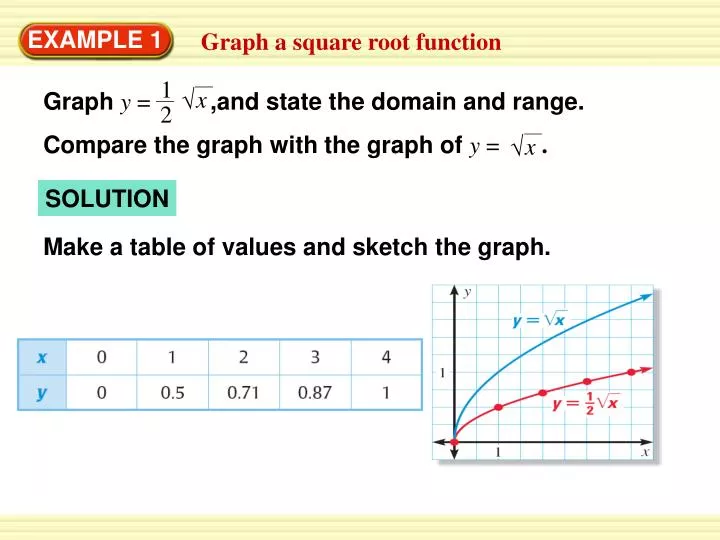
x x Graph y = ,and state the domain and range. Compare the graph with the graph of y = . Make a table of values and sketch the graph. 1 2 EXAMPLE 1 Graph a square root function SOLUTION
x x The radicand of a square root must be nonnegative. So, the domain is x ≥ 0.The range is y ≥ 0. The graph of y =is a vertical shrink of the graph of y = by a factor of . 1 1 2 2 EXAMPLE 1 Graph a square root function
x Graph y =–3 3 , and state the domain and range. Compare the graph with the graph of y =. 3 x Make a table of values and sketch the graph. EXAMPLE 2 Graph a cube root function SOLUTION
3 3 x x The graph of y = – 3 is a vertical stretch of the graph of y = by a factor of 3 followed by a reflection in the x-axis. EXAMPLE 2 Graph a cube root function The domain and range are all real numbers.
l Pendulums The periodof a pendulum is the time the pendulum takes to complete one back-and-forth swing. The period T(in seconds) can be modeled by T = 1.11 where l is the pendulum’s length (in feet). • Use a graphing calculator to graph the model. • How long is a pendulum with a period of 3 seconds? EXAMPLE 3 Solve a multi-step problem
x STEP 1 STEP 2 Use the trace feature to find the value of xwhen y = 3.The graph shows x 7.3. Graph the model. Enter the equation y = 1.11 . The graph is shown below. EXAMPLE 3 Solve a multi-step problem SOLUTION
ANSWER A pendulum with a period of 3 seconds is about 7.3 feet long. EXAMPLE 3 Solve a multi-step problem
1. x y = – 3 Make a table of values and sketch the graph. ANSWER y< 0 Domain: x >0 Range: for Examples 1, 2 and 3 GUIDED PRACTICE SOLUTION
x 2. y = 1 4 ANSWER y< 0 Domain: x >0 Range: for Examples 1, 2 and 3 GUIDED PRACTICE SOLUTION Make a table of values and sketch the graph.
– x 3. y = 3 SOLUTION Make a table of values and sketch the graph. ANSWER 1 Domain: All real numbers Range: All real numbers 2 for Examples 1, 2 and 3 GUIDED PRACTICE
4. g(x)= 4 3 x SOLUTION Make a table of values and sketch the graph. ANSWER Domain: All real numbers Range: All real numbers for Examples 1, 2 and 3 GUIDED PRACTICE
5. What if ? Use the model in example 3 to find the length of a pendulum with a period of 1 second. ANSWER About 0.8 ft for Examples 1, 2 and 3 GUIDED PRACTICE