Download
1 / 19
190 likes | 318 Views
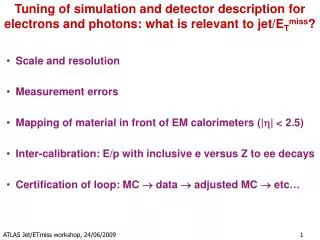
Formant Measurement Errors From Real Speech. Philip Harrison J P French Associates & University of York IAFPA 20 th Annual Conference 24 th – 28 th July 2011 – Vienna. Outline. Motivation & background Formant measurement errors from synthetic speech

E N D
Formant Measurement Errors From Real Speech Philip Harrison J P French Associates & University of York IAFPA 20th Annual Conference 24th – 28th July 2011 – Vienna
Outline • Motivation & background • Formant measurement errors from synthetic speech • Formant measurement errors from real speech – VTR database • Praat • Praat tracker • CAbS tracker • Published results – MSR & WaveSurfer • Discussion l
Motivation & Background All measurements are subject to ‘error’ An estimate of the error should accompany all measurements Increasing use of formant measurements in forensic casework – no errors quoted Significant problem – can’t obtain ‘ground truth’ values from real speech to determine error of formant measurement systems Potential solution – synthetic speech l 3
Errors from Synthetic Speech • Idealised synthetic male speaker • 2,858 monophthongs over F1, F2 vowel space • Specified F1 to F5 centre frequency & bandwidth • Pulse train glottal source, range of F0s (70 – 190 Hz) • Measured formants at different LPC orders (6 to 20) in Praat – Burg (LPC) analysis, not a tracker • Calculation of error: Ferror = Fmeasured – Fspecified • Analysis of errors for F1, F2 and F3 – error surface plots, summary stats (including absolute error, standard deviation – normal (Hz) & percentage) l
Multiple Synthetic Speakers • Variation both within and between real speakers in many speech production parameters – e.g. F0 range, F1-F2 vowel space, formant bandwidths • Single synthetic speaker unlikely to be representative or capture variation • Consider multiple synthetic speakers: • Alternative specified F3 values – 8 speakers • Alternative glottal source signals – 10 speakers l
Multiple Synthetic Speakers – Summary Results • Alternative F3 • Negligible influence on F1, F2 errors • Changes in F3 error surface – influenced by F3 surface • F3 error dependent on location within F1, F2 space – constant F3 speakers – high F1 & F2 -> larger F3 errors • Glottal source signal • Impact on error surfaces & performance – across all formants – some better, some worse than baseline • Localised regions with large errors – greater variation in errors than baseline l
Real Speech • How do these results translate to real speech? • Can’t directly test real speech – reason for using synthetic speech initially • Compare overall performance of real and synthetic speech… l
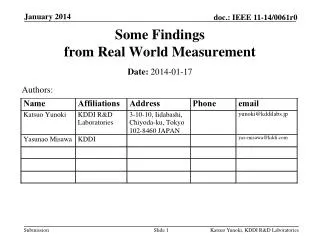
VTR Database • Database of hand-corrected vocal tract resonance values (Deng et al 2006) – balanced subset of TIMIT corpus – good quality digital recs • 516 sentences – 186 speakers (113 male, 73 female) – 61,000 vowel frames, 6,600 vowel tokens • Similar method to synthetic speakers but frame by frame measurements and token means across monophthongs & diphthongs l
Comparison with Synthetic Speech • Both speakers = male, monophthong token average • Best performance of all real results shown l
Can Results be Improved? • Real speech results not as good as synthetic speech • But measurements so far made without any ‘intelligence’ in selection of values • Praat standard formant measurement tool is not a tracker • Formant trackers attempt to select most likely values based on criteria – bandwidth, centre frequency, frame transitions l
Trackers Tested • Trackers • Praat tracker – Viterbi algorithm, considers centre frequency, bandwidth and frame transitions • CAbS tracker (Clermont et al 2007) – cepstral compatibility between original signal and candidate formants, plus continuity constraints • ‘Default’ settings used l
Discussion Even with a tracker real speech results not as good as synthetic performance But VTR database not perfect Does allow comparison of trackers – no obvious ‘winner’ Even though best performance at different LPC orders across F1, F2 & F3, results similar enough to use same LPC order for all formants l 17
Further Questions… What is the variation across speakers and vowel categories? Is it significant? What is the maximum acheivable performance? Is 10% error a realistic estimate? Possibly test more diverse synthetic speech Is 10% error acceptable? What impact does this have on LRs and other numerical analyses (LTFAs)? Are trackers accurate enough to be used unattended on large corpera? How much manual intervention is necessary? l 18
Questions ? Thanks to Frantz Clermont, Peter French & Paul Foulkes References: Clermont, F., Harrison, P. & French, P. (2007) ‘Formant-pattern estimation guided by cepstral compatibility’. Proceedings of IAFPA 2007 Annual Conference, Plymouth, UK. Deng, L., Cui, X., Pruvenok, R., Huang, L., Momen, S., Chen, Y. and Alwan, A. “A database of vocal tract resonance trajectories for research in speech processing,” Proceedings of the IEEE International Conference on Acoustics, Speech, and Signal Processing (ICASSP), Toulouse, France, May 2006. l