Download

1 / 12
120 likes | 270 Views
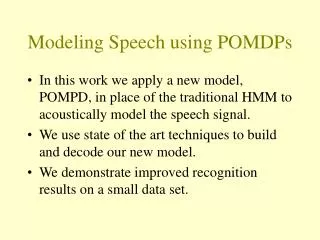
Mixed-Phase Speech Modeling and Formant Estimation Using Differential Phase Spectrums Baris Bozkurt, Thierry Dutoit Faculté Polytechnique De Mons/Belgium. Z-Plane and Discrete Fourier Transform. Causality and frequency response. Mixed-Phase Speech Model. !Spectral Tilt

E N D
Mixed-Phase Speech Modeling and Formant Estimation Using Differential Phase Spectrums • Baris Bozkurt, Thierry Dutoit • Faculté Polytechnique De Mons/Belgium
Mixed-Phase Speech Model • !Spectral Tilt • For source-filter separation, causal and anti-causal parts of the mixed-phase signal needs to be separated. • Causality cannot be observed on amplitude spectrum, so we can look for solutions in phase spectrum.
Analysis of Speech Signal Group Delay Function Problem! Group Delay Functions are most often very noisy Possible reason: Zeros close to unit circle (roots of the z-transform polynomial) Proposal: Calculate differential phase on other circles(than unite circle)
Diff-Phase Spectrum and Amplitude Spectrum Plots for a real speech example
Proposition : Differential Phase Spectrums calculated on circles other than unit circle on z-plane
Analysis of Differential Phase Spectrums Detecting causal and anti-causal resonances R=0.99 R=1.2 R=0.85 R=1.05
Example Plots For Real Speech Signals Inverted!
Difficulties in analysis of differential phase plots Zeros They also exist far from unit circle and may dominate differential phase plots Which value of R to be used There is no single best R value which provides clear pictures of formants. Windowing effects The effect of windowing needs to be studied Hard to imagine the convolution process in z-plane