Download
1 / 15
150 likes | 251 Views
Mercury Reporting Structure Basics. ECMPS Stakeholder Meeting Phoenix, Arizona May 8, 2007 By Matthew Boze. Disclaimer!. This presentation is intended to provide a basic overview of EPA’s plans regarding the reporting format for the various Hg monitoring options

E N D
Mercury Reporting Structure Basics ECMPS Stakeholder Meeting Phoenix, Arizona May 8, 2007 By Matthew Boze
Disclaimer! • This presentation is intended to provide a basic overview of EPA’s plans regarding the reporting format for the various Hg monitoring options • Details are subject to change
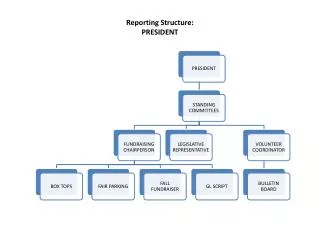
Reporting Instruction Development • First drafts of reporting instructions are being posted separately on EPA’s ECMPS website • The reporting instructions show only sections of the main reporting instruction documents that would be modified to accommodate Hg reporting • All Hg provisions are shown in red text • EPA will eventually merge the Hg instructions into the main reporting instruction documents
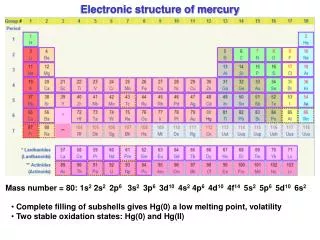
Hg Monitoring Plan • Appropriate codes will be added to various existing fields to identify: • monitoring methodologies, • controls, • monitoring systems & components • etc. • New records will be added to the XML data structure • Calibration Standard Data elements to identify whether the daily calibrations for Hg CEMS are conducted with elemental or oxidized Hg • “HgConvereterIndicator” added to the Component Data Record to identify if a Hg analyzer has a converter • Hg LME qualification record
Hg Quality Assurance Records • The standard QA data structure for the following test types will be used to report Hg QA: • RATA • Bias Test • Cycle Time • 7-day Calibration Error
New Quality Assurance Records for Hg • New records will be developed to handle testing requirements unique to Hg monitoring, such as: • For Hg CEMS: • 3-level system integrity checks (will be similar to linearity data structure) • Hg Linearity Record • Each will be similar to standard linearity data structure, except that the results would be calculated as a percent of span, and not reference value • For Appendix K sorbent trap systems: • Sample Flow Meter Calibrations (for dry gas meters this would include the initial 3 level calibration, to determine the calibration factor and quarterly calibration factor checks) • Other QA (such as temperature sensor calibrations) will be reported as P/F using the miscellaneous test data record similar to transmitter cals for Appendix D
Emissions Data changes for Hg • Daily and weekly QA data • No changes for reporting daily calibrations • Record added for reporting weekly single-level system integrity checks if daily calibrations are conducted using elemental Hg and the analyzer has a converter
Hg CEMS Data • Hourly Hg concentration to be recorded in the MonitorHourlyValueData record including: • Unadjusted hourly value • Bias adjusted hourly value • MODC • System and Component ID • PMA • Hourly Hg mass to be recorded in the MonitorDerivedValueData record including: • Bias adjusted mass value • MODC • Formula ID
Appendix K • Unlike Hg CEMS, Appendix K sorbent trap monitoring does not fit into the generic data structures developed for traditional data monitors • Appendix K will require the use two new records • An hourly sample flow rate data record; and • Sorbent train data record
Hourly Sample Flow Meter Data • An Hourly Sample Flow Meter Data record will be used to: • Report the hourly volume of sample flue gas pulled through the sampling train; • Track the Hourly Stack Flow to Sample flow Rate ratio during the collection period; and • Verify the total sample volume used to calculate Hg concentration for the collection period
Sorbent Train Data • This record will collect all the relevant data for a sorbent train over the course of the collection period, including: • Begin and end date and hour for the collection period • Monitoring system ID and component ID’s • Sorbent Trap Serial numbers • Section 1, and 2 Hg catch • Section 3 Hg spike recovered, and Spike reference value • Total sample volume for the collection period • Unadjusted Hg concentration for the trap
Sorbent Train Data (continued) • This record will also collect the QA results for the sorbent train over the course of the collection period, including: • P/F of post collection leak check • % Breakthough • % Spike Recovery • % Trap agreement (reported in the record for each of the paired traps for a collection period) • Overall QA status code for the sample (P/F/X for Pass/Failed/Lost or Damaged) (does not include % trap agreement) • Sample Damage Explanation/Comment
Appendix K Hg Concentration • The Hg concentration is then reported in the MonitorHourlyValueData record for each hour of the collection period. • If two, validated, Sorbent Train Data records are reported, then the average Hg concentration is to be used • If only one valid sorbent train data record is available, then EPA has proposed a STAF adjustment of 1.222 to that validated result in lieu of substitute data • If data for both sorbent trains are validated but the % trap agreement is beyond the limit, then the higher of the two traps may be used instead of substitute data • Appropriate MODC’s must be used • Hg mass is calculated and reported in the DerivedHourlyValueData record (Same as for CEMS)
Combining CEMS and Appendix K • Some sources may choose to operate a Hg CEMS as a primary monitor and have an Appendix K system as a backup • This can be done, EPA will expect that for any hour that the primary (CEMS) monitor is available that the Hg concentration comes from that system. (Sources may not pick and choose the lower Hg value on an hourly basis!) • When data from the primary monitor is unavailable, data from the App K system may be used if: • All relevant App K data for the entire collection period are reported including: the Hourly Sample Flow Meter Data, and Sorbent Trap Data records • All QA for the Sorbent trap system are up-to-date
Hg LME • Initial Qualification Record to be reported in the QA schema (showing potential to emit) • Initial and ongoing stack tests required to establish and update default Hg concentration. Also reported in the QA schema • Do not report the Hg concentration in the hourly record • Do report the hourly Hg mass in the DHV record consistent with CEMS and Appendix K