Download
1 / 54
540 likes | 551 Views
We routinely observe the Tropical Pacific to forecast El Niño/La Niña and their influence on climate. Sea Surface Height and Temperature Anomalies: Dec 96 - Feb 99. Courtesy of: Rosanna M. Sumagaysay, NASA/JPL Physical Oceanography DAC.

E N D
We routinely observe the Tropical Pacific to forecast El Niño/La Niña and their influence on climate
Sea Surface Height and Temperature Anomalies: Dec 96 - Feb 99 Courtesy of: Rosanna M. Sumagaysay, NASA/JPL Physical Oceanography DAC
Weestablished an operational in situ ENSO Observing System in 1997 • We have an ongoing operational satellite surface temperature capability • We will have continuing observations of sea surface topography from the Jason-1 altimeter mission in 2000
PRECIPITATION Dec98/Feb99 Mid-Nov Forecast (top) Observations (bottom) Courtesy: NOAA’s Climate Forecast Center
Examples of the Influence of Climate on Weather Patterns La Nina and Events in 1998/99 Courtesy of NOAA’s Climate Prediction Center
Global Precipitation Anomalies Forecast (above) & Observed (below) for the 1997/98 El Nino Courtesy of David Anderson ECMWF
But phenomena in addition to ENSO influence our climate: -- Pacific Decadal Oscillation -- Arctic Oscillation -- Indian Ocean Dipole -- Antarctic Circumpolar Wave which we need to observe, understand and forecast and the observations must include the subsurface
Precipitation Surface Air Temperature Wintertime PotentialPredictability El Niño Southern Oscillation (ENSO) ENSO & Pacific Decadal Oscillation (PDO) ENSO, PDO & Arctic Oscillation
Sea Surface Temperature and Sea Level Pressure Anomalies Courtesy of Warren White, Scripps
Correlation of dominant modes of variability of SST and Precipitation in & around Australia (Based on the analysis of a 40-year record) Courtesy of Warren White, Scripps
Correlation between Rainfall and the Indian Ocean Dipole Index Courtesy of Toshio Yamagata, U of Tokyo
We are at a point in time where we can consider putting it all together for the global oceans: -- satellite and in situ observations -- observations and models -- research and operations
Nowcasts (11/25 - 12/25, 1998) Forecasts (thru 1/24/99) Courtesy of Lakshmi Kantha Colorado U
We had a satellite capability to determine surface vector winds for 10 months in 1996/97 • We have that capability again with Quickscat (July 1999) and Sea Winds on ADEOS-2 (late 2001)
Hurricane Gert and Tropical Storms Harvey & Hilary Threaten North America Observations from NASA’s Quikscat on Sept 20, 1999 Courtesy of Liu, Xie & Tang, JPL
Quikscat-derived surface vector winds July 21 to Oct 21, 1999 Courtesy of : Dudley Chelton, OSU
Sea Surface Temperature (SST) Courtesy of Frank Wentz and Chelle Gentemann, RSS
Sea Surface Temperature (deg C) August 24 - 26, 1998 Courtesy of F.J. Wentz, C. Gentemann, D. Smith (Remote Sensing Systems) and D. Chelton (Oregon State University)
For the global oceans, we have: -- satellite coverage of the surface -- communications -- computers and models all capable of operating in near real time However, we lack a complementary in-situ system to observe the subsurface
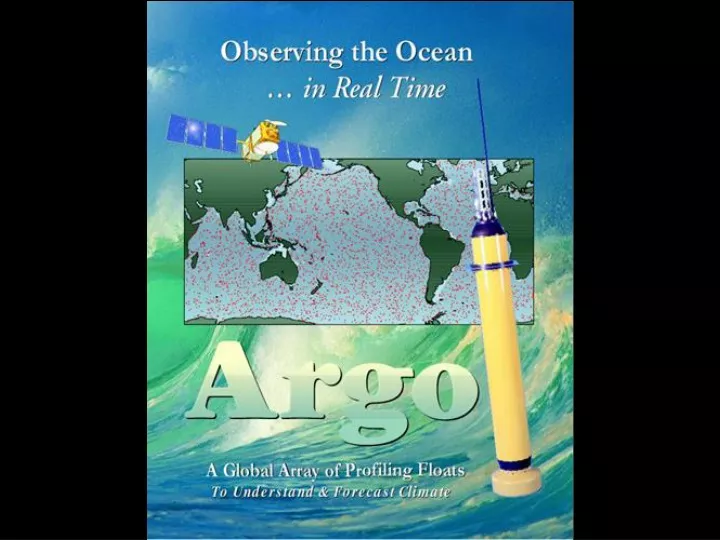
Argo is the next step in global ocean observations It will complement our existing global satellite capability -- surface temperature -- topography -- vector winds
Profiling Autonomous Floats These are oceanic analogues to radiosondes used in operational meteorology • ~ $12,000 each • ~ 4-yr design life • t & s profiles • real-time positioning & communications • deploy from ships of opportunity
Indian Ocean Float Trajectories @ 1000-m depth 25-day steps Jan 95 - Dec 98 Courtesy of Breck Owens, WHOI & Russ Davis, SIO
Labrador Sea Float Trajectories 600 & 1400 m 10-day steps Jan 97 - Dec 98 Courtesy of Breck Owens, WHOI & Russ Davis, SIO
Mixed Layer Depth Deepest Blue 1,000 m or more 10-day steps Jan 97 - Dec 98 Courtesy of Breck Owens, WHOI & Russ Davis, SIO
Real Time, Open Access to Argo Data All 190 floats in the North Atlantic during December, 1998 reported temperature profiles in real time via the GTS
Recent Chronology 1997 -- National Oceanographic Partnership Program established 1998 -- International Year of the Ocean 6/98 -- National Ocean Conference 8/98 -- Congressional Hearing on Ocean Observations 4/99 -- Initial NOPP Report on an Integrated, Sustained Ocean Observing System 7/99 -- WMO/IOC endorsed Argo 10/99 -- ‘OceanObs99’ Conference in St Raphael 2/00 -- Second NOPP Report in press
U.S. Funding Status: -- President Clinton committed $12M over 3 years for 1/3 of the global array -- $1M start-up proposal funded in FY-99 for ~50 floats/year -- Funding via National Oceanographic Partnership Program -- $3M of new funds are available in FY-00 for ~120 floats/year
U.S. Funding Status (continued): -- The $3M is contingent on other countries sharing the funding for Argo floats -- Expressions of interest from Australia, Canada, E.C., France, Germany, Japan, South Korea & U.K.
Argo is one element of a comprehensive international system for observing the global oceans -- Global Eulerian Observatories -- GODAE (2003-2005) -- CLIVAR: ACVE & PBECS -- GOOS/GCOS
Proposed Global Eulerian Observations Courtesy of Bob Weller, WHOI
Why a Global Ocean Data Assimilation Experiment ? Opportunities: • maturity of satellite and in-situ observing systems make real-time global observations feasible • advances in scientific knowledge (e.g. TOGA, WOCE) and our ability to model the global ocean and assimilate data 2003-2005 a good time to mount a demonstration of feasibility and practicality Needs: • user demand for global ocean products for a variety of applications--including scientific research • building a permanent, well-supported ocean observing system requires convincing demonstrations The ocean observing system for climate - St Raphael, October 1999