Download
1 / 28
290 likes | 418 Views
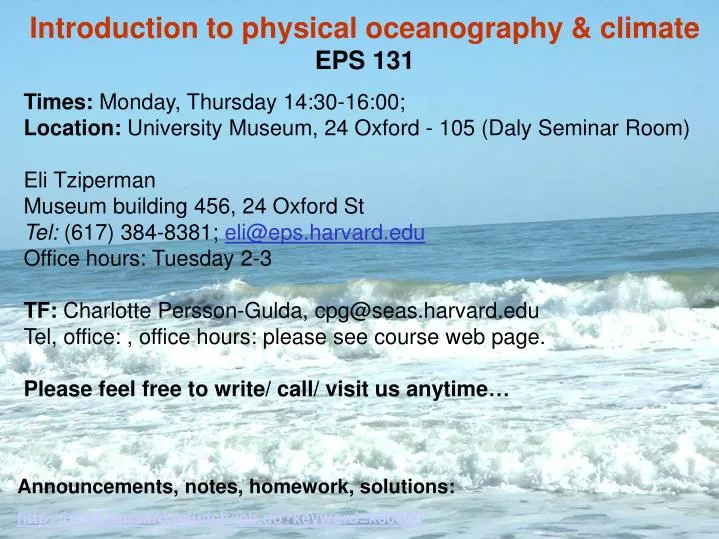
Introduction to physical oceanography & climate EPS 131. Times: Monday, Thursday 14:30-16:00; Location: University Museum, 24 Oxford - 105 (Daly Seminar Room) Eli Tziperman Museum building 456, 24 Oxford St Tel: (617) 384-8381; eli@eps.harvard.edu Office hours: Tuesday 2-3

E N D
Introduction to physical oceanography & climateEPS 131 Times: Monday, Thursday 14:30-16:00; Location: University Museum, 24 Oxford - 105 (Daly Seminar Room) Eli Tziperman Museum building 456, 24 Oxford St Tel: (617) 384-8381; eli@eps.harvard.edu Office hours: Tuesday 2-3 TF:Charlotte Persson-Gulda, cpg@seas.harvard.edu Tel, office: , office hours: please see course web page. Please feel free to write/ call/ visit us anytime… Announcements, notes, homework, solutions: http://isites.harvard.edu/icb/icb.do?keyword=k80060
EPS131 logistics Course requirements: Best 90% of Semi-weekly homework will constitute 40% of grade; Two class presentations & class demonstration of a fluid experiment (20%); Final (possibly a take home, 40%). Needed preparation: APM 21a,b/ Math 21a,b; Physics 15 (or 11); no programming preparation expected, Matlab will be introduced & used Matlab Intro sessions: this week! Please see course web page Textbook(s): Knauss, introduction to physical oceanography, 2nd edition, 1996, Also useful: The open university team: (1) Ocean circulation, 2nd ed, 2002; (2) Waves, tides and shallow water processes, 2nd ed, 2002. (3)Kundo & Cohen, Fluid mechanics. 2nd ed ’02; (4) Stewart, on-line physical oceanography book. Course web page: homework, announcements, student presentations … http://isites.harvard.edu/icb/icb.do?keyword=k80060 Teaching notes with links to on-line sources for lectures: http://www.seas.harvard.edu/climate/eli/Courses/EPS131/2012spring/teaching-notes-intro-physical-oceanogr.pdf
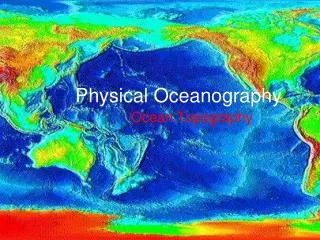
Outline • The basics, what we observe: • Coriolis force • Ocean temperature, salinity, currents • Gulf stream, variability, rings, eddies • Waves, tides, Tsunamis • How we observe: Ships, satellites, airplanes, moorings, current meters, buoys, floats, sound waves... • How we try to understand it all: From theory to data analysis; From Pencil/ paper to super computers • Oceans and climate:Monsoons,Thermohaline circulation; El Nino; abrupt climate change, Glacial cycles; global warming, …
Coriolis force (J. Marshall, MIT) Coriolis force acts to the right of the motion in the northern hemisphere, and to left in the southern hemisphere. Toilet Bowl Water Twirls Clockwise? It’s not the Coriolis force…
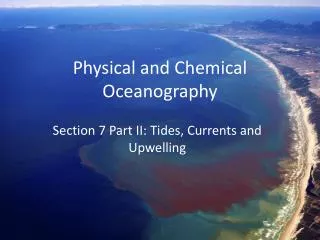
Coriolis force, Coastal Upwelling and fisheries • Currents created by winds, are diverted by the Coriolis force, resulting in water being carried away from shore. Deep, cold water rises to replace these waters, resulting in coastal upwelling. • The rising water is rich in nutrients, attract plankton & create rich fisheries. Temperature and chlorophyll concentrations along the California coast
Coriolis force, highs/lows, ocean surface “topography” • Air/water does not flow from high to low pressure… • Instead, Coriolis force causes flow along • equal pressure lines • surface height difference across the • width of the Gulf Stream (50km) is • about one meter (!)
Cold water is nearest surface at equator, which is the warmest area… Temperature • North-South • Section. • Bottom • temperature • Is near 0 deg • even at Equator… • Horizontal map, • Sea surface • temperature Mixed layer Thermocline
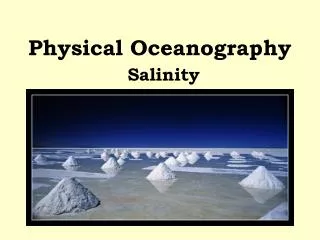
Salinity • ?? kg salt/meter cubed • Evaporation, precipitation, ice melt... Salinity along Atlantic ocean, vertical axis exaggerated by 1000s
Gulf Stream/ Kuroshio: western boundary currents Note east-west Asymmetry! (Strong western vs weaker eastern boundary currents) 1753-1774, deputy postmaster general, North America Cold California Current: 2M m^3/sec; 0.1m/s Warm Gulf Stream: 150 M m^3 /sec, 1-2m/s His cousin’s map of a feature known for 250 yr
Ocean Eddies • 1970s: nothing is steady in ocean • There is turbulence in the ocean on all scales from mm to 100s km. The large turbulent features are “eddies” • Similar to weather systems, but X10 smaller; move/ change much slower (weeks & months instead of days) Chlorophyll-a from ocean color, SeaWIFS, East Australia Current Temperature, US east coast
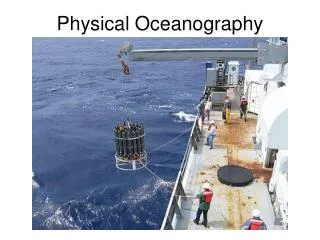
TOPEX Observing the oceans • From the Challenger (1870s) to the World Ocean Circulation Experiment (WOCE/1990s) • Satellites: Altimeter (TOPEX), SST, wind (QuickScat), chlorophyll, sea ice… • Floats, moorings…, CTD, bottles, … RAFOS float Challenger WOCE ALACE float trajectories
Ships, satellites, moorings, floats CTD, (field trip to cape code and WHOI…)
Ships, satellites, moorings, floats Altimeter: radar measuring ocean surface height
Waves, Tides, Tsunami • There is much more to waves than just surface waves at the beach… • Tides are surface waves, and so are Tsunami • Fu Chuan-Fu & friends
Waves, Tsunami, Tides • Caused by undersea earthquakes, landfalls • propagate as undetectable low-amplitude surface waves • speed= • slows down and height increases to 10s m when approaching shallow coast. 1992, Indonesia, 3-4m waves
Wave motions that affect the thermocline instead of the surface. Have wave lengths of 100-1000km, amplitude of 10s meter Internal waves Internal waves showing as calm bands (slicks) at ocean surface
Climate! • Thermohaline circulation • Abrupt climate change • El Nino • Future climate change
Thermohaline circulation & Global climate • THC carries 20M meter cubed of water per second (all rivers combined: 1M) • Carries a significant part of the heat transport from the equator to the pole • Driven by temperature differences, “braked” by salinity • May vary on a time scales of decades, affecting European climate • Its past variations may have caused abrupt climate change. “Day after tomorrow…”
The THC and past climate Europe's Little Ice Age, 14th Century; Pieter Breugel the Elder. Norse ruins from Brattahlid, Greenland. “Eirik the Red,” exiled from Iceland for his crimes, 980 A.D., set sail and spotted “Greenland”. 1,000 Scandinavians lasted until 1480 A.D., died by starvation due to nasty winters.
Abrupt past climate change (due to thermohaline circulation changes?)
Development of an El Nino event: a comparison of two major El Nino events:
Observations: The irregular variations between El Nino and La Nina limit predictability • Period 3-6 years • recent enhancement or decadal variability?
Ocean’s role in global warming • Sea level rise: • Thermal expansion • Melting • Abrupt climate change: • sea ice (show two animations!) • thermohaline circulation • Absorbing ½ of emitted CO2 • Absorbing heat, slowing warming • Ocean acidification, corals
Summary • Basics: • Temperature, salinity, density • Currents, Coriolis, coastal upwelling • Western boundary currents, general circulation, eddies • Waves: surface, internal, tides, Tsunamies • Observations: satellites, floats, moorings, ships • Climate: Thermohaline circulation: climate’s conveyer belt; El Nino; abrupt climate change; future climate