Download
1 / 19
190 likes | 312 Views
Some aspects of the STERAO case study simulated by Méso-NH. by Jean-Pierre PINTY, Céline MARI Christelle BARTHE and Jean-Pierre CHABOUREAU Laboratoire d’Aérologie, Toulouse < http://www.aero.obs-mip.fr/mesonh >. WMO workshop, Hamburg, July, 2004.

E N D
Some aspects of the STERAO case study simulated by Méso-NH by Jean-Pierre PINTY, Céline MARIChristelle BARTHE and Jean-Pierre CHABOUREAULaboratoire d’Aérologie, Toulouse <http://www.aero.obs-mip.fr/mesonh> WMO workshop, Hamburg, July, 2004
Multidisciplinary modeling of the STERAO case study (simulations performed on a large domain but at moderate resolution, Dx=1km) • Dynamics: resolved and turbulent flow • Microphysics: mixed-phase processes • Chemistry: Transport of +/- soluble species • Electricity: lightning flash and NOx production • Strong coupling between the flow structure, the water cycle, the cloud electrisation and the scavenging of gases • Requires a simultaneous integration of all the processes WMO workshop, Hamburg, July, 2004
Kinetic approach of mass transfer for soluble gases gas phase: Cg and 2 aqueous phases: Cc (cloud droplets), Cr (raindrops) - With Mass Transfer terms as in Chaumerliac et al., 1987, Barth et al., 1992, … ktc: mass transfer coef. (particle size dependent) KH: Henry’s law coef. WMO workshop, Hamburg, July, 2004
Charge separation and exchange Microphysical and dynamical processes Charge transport Electric field computation no ||E|| > ||E||trig Bi-leader phase Lightning channel vertical extension yes ||E|| > ||E||prop Pseudo-fractal scheme Lightning channel radial extension Partial neutralization of charges Flow chart of the electrical scheme WMO workshop, Hamburg, July, 2004
Domain • horizontal grid : 120 x 120 points at 1 km resolution with open LBC • 50 levels : from 70 m (bot) up to 600 m (top) with wave damping • Physics • transport with MPDATA scheme • microphysics: Pinty-Jabouille • electricity: Barthe-Pinty-Molinié • gas scavenging & LiNOx: Mari-Pinty • 3D turbulence (TKE): Cuxart-B-R • Initialization • R/S with 3 warm bubbles (3K) • profiles of HCHO, H2O2, HNO3 • profiles of CO, NOx, O3 • 3 hour run on the 12 LINUX cluster @ LA Set-up of Méso-NH Ice and Wind fields T=1 hour @ Z=10 km
Upper level flow @ z=10 km A C W~45 m/s W~25 m/s B D Time = 1 hour Time = 2.5 hours WMO workshop, Hamburg, July, 2004
Peak vertical velocity/electrical activity Flash length < 1000 km/min Electric field < 200 kV/m Multicell stage Transition to Supercell WMO workshop, Hamburg, July, 2004
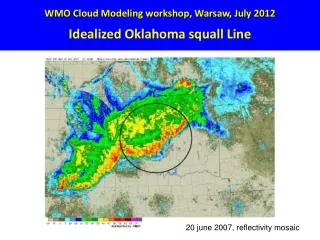
Microphysical fields Ice+Snow Graupels (coloured) Rain Gravity waves Radar reflectivity Time = 1 hour Time = 2.5 hours
Mixing ratio and Z peak values Rc max ~ 4.0 g/kg Rr max ~ 2.0 g/kg Ri max ~ 1.5 g/kg Rs max ~ 1.0 g/kg Rg max ~ 9.0 g/kg Radar reflectivity < 45 dBZ which is less than observed Presence of hail ? WMO workshop, Hamburg, July, 2004
Stratosphere Transport of H2O, CO and O3 (1) 5 %<Relative Humidity<95 % 75 ppb<CO<130 ppb Stratosphere 50 ppb<O3<130 ppb Time = 1 hour WMO workshop, Hamburg, July, 2004
Stratosphere Transport of H2O, CO and O3 (2) 5 %<Relative Humidity<95 % 75 ppb<CO<130 ppb Stratosphere 50 ppb<O3<130 ppb Time = 2.5 hours WMO workshop, Hamburg, July, 2004
(Scale is [0, 2 ppb]) Stratosphere Gas Transport & Scavenging HNO3 H2O2 HCHO Time = 2.5 hours WMO workshop, Hamburg, July, 2004
LNOx production @ z=10 km The net LNOx production rate is continuously derived from the electrical scheme with d(LiNOx)/dt = F(Lflash) after Wang et al. (2000) LNOX scale in ppb LNOX scale in 100 ppt Time = 1 hour Time = 2.5 hours Peak value ~ 3.5 ppb Peak value ~ 0.1 ppb High spatial and temporal variability WMO workshop, Hamburg, July, 2004
Conclusion and Perspectives • STERAO is a good modeling exercise for several aspects of the deep convection: • dynamics and microphysics • gas transport and scavenging • cloud electricity and LNOx production • Results are recent and need a careful evaluation against the available dataset • Model runs on a larger domain to produce more realistic fluxes and budgets • Parts of the model will be improved • lightning flash algorithm • inclusion of the ice phase for the gas scavenging • careful evaluation of the LNOx production rate WMO workshop, Hamburg, July, 2004
Anvil flux density computation WMO workshop, Hamburg, July, 2004
Anvil flux densities(where S rglace > 0.01g/kg) Max flux (air) = 5.46 kg/m2/s Max flux (CO) = 1.90 e-5 mole/m2/s Max flux (O3) = 2.28 e-5 mole/m2/s Max flux (NOx) = 4.65 e-8 mole/m2/s Lightning NOx flux is {LNOx-TNOx} flux WMO workshop, Hamburg, July, 2004
Anvil flux densities(where S rglace > 0.01g/kg) After 3 hours: Flux (HCHO) = 1.11 e-7 mole/m2/s Flux (H2O2) = 1.10 e-7 mole/m2/s Flux (HNO3) = 8.41 e-8 mole/m2/s WMO workshop, Hamburg, July, 2004
Precipitation field 3 hour rainfall ~ 6.2 mm « Cell pulsating » precipitation pattern Instantaneous rate < 25 mm/h WMO workshop, Hamburg, July, 2004
Lightning NOx field Instantaneous peak value ~ 8 ppb Total mass max ~ 8800 kg WMO workshop, Hamburg, July, 2004