Download
1 / 30
300 likes | 392 Views
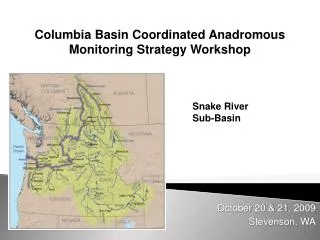
Mid-Columbia Coordinated Hydro Operations Model. John C. Howard CddHoward Consulting Ltd. (jchoward@cddhoward.com) CEATI 2009. Plan for this talk. System of seven dams Objective and constraints for optimization Results for three study scenarios Excel optimization environment issues.

E N D
Mid-Columbia Coordinated Hydro Operations Model John C. Howard CddHoward Consulting Ltd. (jchoward@cddhoward.com) CEATI 2009
Plan for this talk • System of seven dams • Objective and constraints for optimization • Results for three study scenarios • Excel optimization environment issues CddHoward Consulting Ltd.
Purpose and Scope of this Study • Purpose • Identify opportunities for revised coordination of river system operations • Scope • Cascade of seven hydro projects • Study Historical Scenarios with a range of Hydrologic and System-Load Conditions • Uses an iterative QLP optimization CddHoward Consulting Ltd.
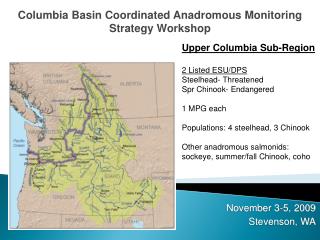
Columbia River Basin Canada Mid-Columbia USA CddHoward Consulting Ltd.
Mid-Columbia System FT MW KW/CFS 334 7,049 24.8 176 2,069 13.1 74 890 5.4 94 1,320 7.1 43 622 3.3 83 831 6.0 60 788 4.5 865 13,570 64.2 Grand Coulee Chief Joseph Wells Rocky Reach Rock Island Wanapum Priest Rapids TOTAL CddHoward Consulting Ltd.
Grand Coulee 334 ft 7,049 MW 24.8 kW/CFS CddHoward Consulting Ltd.
Chief Joe 176 ft 2,069 MW 13.1 kW/CFS CddHoward Consulting Ltd.
Wells 74 ft 890 MW 5.4 kW/CFS CddHoward Consulting Ltd.
Rocky Reach 94 ft 1,320 MW 7.1 kW/CFS CddHoward Consulting Ltd.
Rock Island 43 ft 622 MW 3.3 kW/CFS CddHoward Consulting Ltd.
Wanapum 83 ft 831 MW 6.0 kW/CFS CddHoward Consulting Ltd.
Priest Rapids 60 ft 788 MW 4.5 kW/CFS CddHoward Consulting Ltd.
Hourly Optimization • Maximize Energy-In-Storage at Last-Hour • Meet Historical Hourly Load (± 5MW) • Realistic Plant Operations, Wave Routing, Local Sideflows, Encroachments and Seasonal Discharge Constraints (Fish) CddHoward Consulting Ltd.
Plant Envelope Model Plant Envelope CddHoward Consulting Ltd.
WEL: 74ft @ 890MW 35 Miles Transient Wave Routing CddHoward Consulting Ltd.
Douglas County, WA Grant County, WA Irrigation Returnflows & Sideflows • Ungauged or Poorly Estimated • Varies by 1% to 10% of Inflow(t) • Preprocessed to balance mass CddHoward Consulting Ltd.
Grant County WA Rock Island Wanapum Encroachment • Significant Issue for most of the projects • Encroachment Model • Function of DS elevation and US discharge • Example: Wanapum pool encroaches on Rock Island tailwater CddHoward Consulting Ltd.
Environmental Constraints • 7ft Higher Pools on LaborDay Weekend • 5ft Higher Pools on LaborDay Weekend • Increased Min Flows in March and Oct-Nov • Increases in Maximum River Stage in the Mid-Mornings of March and Oct-Nov CddHoward Consulting Ltd.
Coordinated Generation • Meet time varying load • Move water to ‘right’ pool at ‘right’ time • Operate plants consistent with Unit Commitment & Dispatch • Meet constraints CddHoward Consulting Ltd.
Basic Optimization Excel as a Modelling System Easy • Data Analysis and Verification • Formula Coding • Database Coding • Spreadsheet Debugging • Deployment Easy Tricky Difficult Tricky CddHoward Consulting Ltd.
Model Validation • Switch Model into ‘Simulation Mode’ • Historical Discharges drive Model • Results create ‘Basis for Comparison’ • Historical vs Validation vs Optimized • Compare Model Generation and Pool Levels to Measured data. CddHoward Consulting Ltd.
Δ ± 5 MW Optimized Discharge Historical System Load Optimize Mode Validation Mode Historical Discharge Δ Historical Plant MW MW Validation Model Schematic and Modes 7 Dam Cascade Plant CddHoward Consulting Ltd.
Project Configurations Hourly Data Hourly Constraints Data and Configuration • Tables for Project Configurations • Date & Time Driven Tables for Operational Constraints • Hourly-Data Worksheet for the Current Scenario CddHoward Consulting Ltd.
Scenario and Optimization Control • pic – toolbar • pic – torn worksheet tabs, stacked CddHoward Consulting Ltd.
Evaluating Results • Actual Operations Contain Inconsistent Data • Validation is Replicable • Validation is the Gold Standard • Compare Model to Validation CddHoward Consulting Ltd.
Optimized Hourly Stored Energy CddHoward Consulting Ltd.
Summary • 3.5% More System Energy in Sample Scenario • Operations Dependant on Load Forecast • Excel can be a good Open Platform CddHoward Consulting Ltd.
Thank You! CddHoward Consulting Ltd.
Optimized Hourly Pool Level Changes Scenario 1 CddHoward Consulting Ltd.
Optimized Generation Improvements Scenario 1 CddHoward Consulting Ltd.