Download
1 / 56
560 likes | 679 Views
Mobility Management: Value for money. Contributions by Walter Bien, Jan Christiaens Moderated by Graham Lightfoot (Mendes GoCar Limited) ECOMM 2009 May 15 – Donostia/San Sebastián. Introduction. Graham Lightfoot (Mendes GoCar Limited) ECOMM 2009 May 15 – Donostia/San Sebastián.

E N D
Mobility Management: Value for money Contributions by Walter Bien, Jan Christiaens Moderated by Graham Lightfoot (Mendes GoCar Limited) ECOMM 2009 May 15 – Donostia/San Sebastián
Introduction Graham Lightfoot (Mendes GoCar Limited) ECOMM 2009 May 15 – Donostia/San Sebastián
Today’s interactive session • welcome to ELTIS Café and introduction to ELTIS (5’) • value for money: cost benefits (30’) • discussion round 1 (20’) • changeover (5’) • discussion round 2 (20’) • wrap up and general conclusions (10’) Eltis Café @ ECOMM 2009 www.eltis.org www.eltis.org
Introduction and goal • The ELTIS Café wants to boost dialogue and exchange experience and ideas in small but inspiring groups. • The ELTIS Café aims to further encourage the exchange of ideas and experiences in a less formal but still unconventional way. • To do this, ELTIS organises several sessions at various events where participants sit together at small tables as in a café. • Brief presentations by proponents of different viewpoints on the same topic are made and then two rounds of discussion are held. Eltis Café @ ECOMM 2009 www.eltis.org www.eltis.org
What is ELTIS? The European Local Transport Information Service(ELTIS) isEurope‘s number one web portal on urban transport and mobility It is an initiative of the European Commission's Directorate General for Energy and Transport Eltis Café @ ECOMM 2009 www.eltis.org www.eltis.org
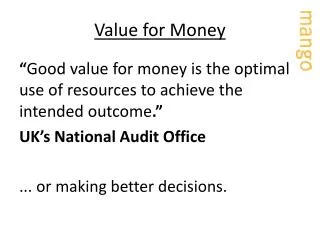
ELTIS aims to: Provide information and support the exchange of experience in the field of urban and regional transport in Europe. www.eltis.org
On-line contents • News • Events • Calls and tenders • Tools for practitioners • EU initiatives and policies • Case studies • Links • User association • Vote & win Eltis Café @ ECOMM 2009 www.eltis.org www.eltis.org
Mobility Management: Value for money? Jan Christiaens/ Lies Lambert (Mobiel 21) ECOMM 2009 May 15 – Donostia/San Sebastián
Mobility Management… • a concept to promote sustainable transport and manage the demand for car use by changing travellers’ attitudes and behaviour • at the core of Mobility Management are "soft" measures • does it work? • at all? • effective? • efficient? • cost-benefit? …is it any good? Eltis Café @ ECOMM 2009 www.eltis.org www.eltis.org
Does it work? At all? • The ECOMM and EPOMM community is a clear believer. • “Obviously, because Mobility Management pays your bills .“ • Like the baker stating • that fresh bread from the • bakery is a healthy and • delicious way to start the day… • Where is the real proof? Eltis Café @ ECOMM 2009 www.eltis.org www.eltis.org
Does it work? At all? (2) Proof is in eating the pudding: hundreds of cases Eltis Café @ ECOMM 2009 www.eltis.org www.eltis.org
Does it work? Efficient/effective? Tons of cases Years of good and best practice Us knows us But what does average Joe know about Mobility Management and does he notices anything whilst travelling? Eltis Café @ ECOMM 2009 www.eltis.org www.eltis.org
ECOMM 2008 London Key note opened stating (once more) that Mobility Management is part of an integrated approach: only a combination of elements works (in that case it was in dealing with climate change). Like we all know but sometimes seem to forget. Problem: the other parts are often easy to measure. Eltis Café @ ECOMM 2009 www.eltis.org www.eltis.org
Efficiency in Sustainable Mobility • Published February 2009 • A case/role for Mobility Management? • Rather a clear lack of it: • Mobility Management is not a theme nor subtheme - Transport Demand Management is a subtheme, mainly looking at pricing issues • Referral to MAX (Successful Travel Awareness Campaigns and Mobility Management Strategies) and MOVE (International cluster for mobility management development and research dissemination) as projects with results not yet available. Eltis Café @ ECOMM 2009 www.eltis.org www.eltis.org
Efficiency? Olympics Bejing • Enormous Mobility Management efforts • A huge majority wanted the Olympic games to be a success story at all levels. • Governmental appeal/pressure with the result that all shared a common goal. • That included taking unpopular MM measures (mainly aimed at air quality). • Social ! Psychology ! • Alas, we are mostly not working on such big projects Eltis Café @ ECOMM 2009 www.eltis.org www.eltis.org
Selling MM = project appraisal Eltis Café @ ECOMM 2009 www.eltis.org www.eltis.org
Selling MM = showing cost-benefits Eltis Café @ ECOMM 2009 www.eltis.org www.eltis.org
A new approach for MM benefit-estimation Walter Bien ECOMM 2009 May 15 – Donostia/San Sebastián
Overview • Effect Estimation within changing framework/conditions • The classical (best) approach:Evaluation of treatment groups and “placebo”-groups • Estimation of change in the mobility/traffic area (modal split, PT passenger numbers, …) using statistical data (inhabitants, number of cars, commuters, PT offer, …) • Comparison of estimated and measured values • Example: Development of the number of PT passengers in Frankfurt from 1995 to 2010 Eltis Café @ ECOMM 2009 www.eltis.org www.eltis.org
Effect Estimation within changing framework/conditions Compare: The “fat car driver” vs. the “slim biker” Eltis Café @ ECOMM 2009 www.eltis.org www.eltis.org
… starting with mobility management measures in the year 2000 … establish mobility management in the following years „success“ of mobility management ??? * means: preliminary
… but in the same two periods we have a strong increase of income by ticket sales (based on a higher price level) „success“of mobility management … could be ?
… the increase of customer potential (inhabitants and employees) is less in the second period „success“ of mobility management … yes !
„success“ of mobility management: … Yes (in a special manner) if we assume that there would be a decrease of the number of PT passengers and a less increase of income without mobility management …
The problem: effect estimation of measures … we can see non effect of fuel priceson the developement of PT passengers
The PT offer is stable in the first period while the usage icreases for 15%. In the second period PT offer and also the usage is grown up for 6-7%-points.
The classical (best) approach: Evaluation of treatment groups and “placebo”-groups Remember – (Eric Schreffler; S. Diego): The data never lie – but do we so ?
The classical (best) approach: Evaluation of treatment groups and “placebo”-groups But also (Herbert Kemming, germany): … The control group method… and its problems
Estimation of change in the mobility/traffic area (modal split, PT passenger numbers, …) using statistical data (inhabitants, number of cars, commuters, PT offer, …)
Structural data: important for modal-choice / „available“ In the slides before we have to deal with this kind of data: • Number of Public Transport Passengers • PT income by ticket sales • Inhabitants (in city/region) • Employees (in city/region) • Fuel price • PT offer (in km*places - offered) • PT usage (in km*places - used) … and all this data are almost available – and can be used (in combination with some others) to estimate effects of measures.
… on the next slide – see the combination
Combining structural data with passenger-numbers in public-transport The weighted combination of 4 single-indicator values is a good fitting indicator for the developement of PT-passenger-numbers: Inhabitants of frankfurt (weight: 1)+ (reciprocal) number of cars (weight: 2)+ employees (working) in frankfurt (weight: 3)+ number of commuters to frankfurt (weight: 4)--------------------------------------------------------------------------- average of the indicators above = indicator for pt-passengers
Combining structural data with passenger- numbers in public-transport
Combining structural data with passenger- numbers in public-transport
Now we can construct a so called „Target Value“ for the number of PT passengers. This is a weighted combination of the indicator-value before (combined by the 4 structural data) and the PT-offer (see slide no.8): Indicator Value (weight: 2) + PT offer (weight: 1)------------------------------------------------------------- Combining structural data with passenger- numbers in public-transport average of the indicators above = Target Value for PT-passengers
Comparison of estimated and measured values The convincing argument: Decisive – is the final result ! In german: “… was hinten rauskommt.”
Combining structural data with passenger- numbers in public-transport … now we can see the difference between the (realized) number of PT passengers and the expected number (target value) of PT passengers …
Conclusion • It becomes possible to determine the effects of other measures - such as mobility management or further soft-policies in PT (advertisement, special efforts of information...) - separately and also prove their economic efficiency. • Regarding the Frankfurt-area this approach shows that since the year 2000 with rising tendency, the applied measures have generated additional fare income within a two-digit million range (of EUROs). • The lower costs (for mobility management) must lead to a continuation and legitimate the spending of money not only from an organisational/company-internal but also from a political and public point of view.
Example:Development of the number of PT passengers in Frankfurt from 1995 to 2010
Next steps and chances • If the economic effects of mobility management and other soft traffic policies can be estimated quantitatively in an easy way with only few available indicators, low priced basic conditions for these measures can be achieved. • The broad application and testing of this methodology would induce an equal treatment of soft policies and mobility management with rather "hardware-oriented" measures as for example new travel offers (temporal/spatial), new vehicles or price-arrangements in the PT-sector.
Next steps and chances • In a further step a methodology can be developed, which permits effect estimations for mobility management in advance, like it has already been implemented in the German-speaking-area by the so-called "standardized evaluation" for all kind of infrastructure measures. • And that means: New and equal opportunities for mobility management!
… and so – we reach her/him: the “multi-modal” mobility-user
Modal-choice of the inhabitants of Frankfurt (~ 670.000 p.) car & bike 14% bike (at all) 40% car (at all) 82% bike (only) 6% car (only) 37% PT & bike 5% PT & car & bike 15% PT (only) 7% PT (at all) 43% car & PT 16%
Sustainable developement in modal-choice bike (at all) 57% car & bike 4% car (at all) 58% bike (only) 13% car (only) 24% PT & car & bike25% PT & bike 15% PT (only) 14% PT (at all) 59% car & PT 5%