Download
1 / 1

E N D
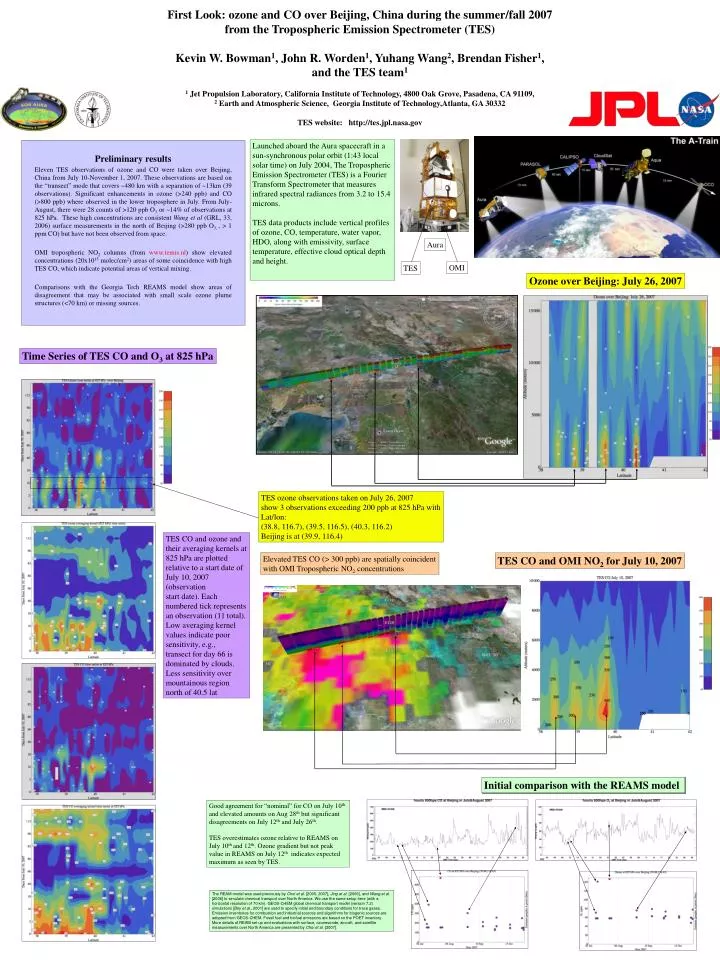
Preliminary results Eleven TES observations of ozone and CO were taken over Beijing, China from July 10-November 1, 2007. These observations are based on the “transect” mode that covers ~480 km with a separation of ~13km (39 observations). Significant enhancements in ozone (>240 ppb) and CO (>800 ppb) where observed in the lower troposphere in July. From July-August, there were 28 counts of >120 ppb O3 or ~14% of observations at 825 hPa. These high concentrations are consistent Wang et al (GRL, 33, 2006) surface measurements in the north of Beijing (>280 ppb O3, , > 1 ppm CO) but have not been observed from space. OMI tropospheric NO2 columns (from www.temis.nl) show elevated concentrations (20x1015 molec/cm2) areas of some coincidence with high TES CO, which indicate potential areas of vertical mixing. Comparisons with the Georgia Tech REAMS model show areas of disagreement that may be associated with small scale ozone plume structures (<70 km) or missing sources. First Look: ozone and CO over Beijing, China during the summer/fall 2007 from the Tropospheric Emission Spectrometer (TES) Kevin W. Bowman1, John R. Worden1, Yuhang Wang2, Brendan Fisher1, and the TES team1 1 Jet Propulsion Laboratory, California Institute of Technology, 4800 Oak Grove, Pasadena, CA 91109, 2 Earth and Atmospheric Science, Georgia Institute of Technology,Atlanta, GA 30332 TES website: http://tes.jpl.nasa.gov Launched aboard the Aura spacecraft in a sun-synchronous polar orbit (1:43 local solar time) on July 2004, The Tropospheric Emission Spectrometer (TES) is a Fourier Transform Spectrometer that measures infrared spectral radiances from 3.2 to 15.4 microns. TES data products include vertical profiles of ozone, CO, temperature, water vapor, HDO, along with emissivity, surface temperature, effective cloud optical depth and height. Aura OMI TES Ozone over Beijing: July 26, 2007 Time Series of TES CO and O3 at 825 hPa TES ozone observations taken on July 26, 2007 show 3 observations exceeding 200 ppb at 825 hPa with Lat/lon: (38.8, 116.7), (39.5, 116.5), (40.3, 116.2) Beijing is at (39.9, 116.4) TES CO and ozone and their averaging kernels at 825 hPa are plotted relative to a start date of July 10, 2007 (observation start date). Each numbered tick represents an observation (11 total). Low averaging kernel values indicate poor sensitivity, e.g., transect for day 66 is dominated by clouds. Less sensitivity over mountainous region north of 40.5 lat Elevated TES CO (> 300 ppb) are spatially coincident with OMI Tropospheric NO2 concentrations TES CO and OMI NO2 for July 10, 2007 Initial comparison with the REAMS model Good agreement for “nominal” for CO on July 10th and elevated amounts on Aug 28th but significant disagreements on July 12th and July 26th. TES overestimates ozone relative to REAMS on July 10th and 12th. Ozone gradient but not peak value in REAMS on July 12th indicates expected maximum as seen by TES. The REAM model was used previously by Choi et al. [2005, 2007], Jing et al. [2006], and Wang et al. [2006] to simulate chemical transport over North America. We use the same setup here (with a horizontal resolution of 70 km). GEOS-CHEM global chemical transport model (version 7.2) simulations [Bey et al., 2001] are used to specify initial and boundary conditions for trace gases. Emission inventories for combustion and industrial sources and algorithms for biogenic sources are adopted from GEOS-CHEM. Fossil fuel and biofuel emissions are based on the POET inventory. More details of REAM set up and evaluations with surface, ozonesonde, aircraft, and satellite measurements over North America are presented by Choi et al. [2007].