Download
1 / 32
320 likes | 426 Views
How AWIPS II will bring GOES-R Capabilities and Science to the Field, both Pre- and Post-Launch. Jordan Gerth , Research Assistant Cooperative Institute for Meteorological Satellite Studies, University of Wisconsin. Joint NWA/GUC Session I – Thursday , October 20, 2011

E N D
How AWIPS II will bring GOES-R Capabilities and Science to the Field, both Pre- and Post-Launch Jordan Gerth, Research Assistant Cooperative Institute for Meteorological Satellite Studies, University of Wisconsin Joint NWA/GUC Session I – Thursday, October 20, 2011 National Weather Association Annual Meeting, Birmingham, Alabama
Panning and Zooming in AWIPS II with GOES-R Simulated ABI Channels 13 through 16
Contributors to this Presentation • KabaBah, Lee Cronce, Mat Gunshor, and Justin Sieglaff, CIMSS • Robert Aune and Tim Schmit, NESDIS ASPB • Bill Campbell, Tom Kretz, and Ed Mandel, NWS OST • Frank Griffith and programmers at Raytheon • For more information on cloud and moisture imagery (CMI) delivery in the GOES-R era, see the “GOES-R Sectorized Cloud and Moisture Imagery Products” poster P4.18 in the NWA/GUC Joint Poster Session • SectorizedCMI data streaming from GOES-R Ground Segment (GS) into AWIPS. • Each netCDF4 file holds one tile. • Each tile is a subset of a complete satellite image. • Tile size will be configurable (e.g., 1024X1024 pixels).
Presentation Outline • Current capabilities (GOES-N/O/P) • GOES-R/S Series • GOES-R Proving Ground • AWIPS and AWIPS II • Data Fusion • GOES-R AWG, AWIPS II Examples • RGB/RGBA Image Combinations • Simulated ABI Longwave Channels • Potential AWIPS II Capabilities • Conclusions and Future Directions
GOES-13/14/15 (N/O/P, 2010 to 2020) • Geostationary Operational Environmental Satellite • GOES-13 is currently GOES-East • Imager has five channels • Visible at 1 km spatial resolution • Shortwave IR, Water Vapor, Clean IR Window at 4 km • Dirty IR Window at 8 km on 13, 4 km on 14/15 • Depending on scan strategy, new CONUS image every 15 minutes • Sounder has nineteen channels • One visible channel, 18 infrared channels for temperature and moisture soundings, including 3 water vapor channels and one ozone channel, all at approximately 8 km resolution • Available approximately once per hour, US only
GOES-R/S Series (2017 to 2028) • Launching in 2015, GOES-R is expected to be GOES-West • Two meteorological instruments • The Advanced Baseline Imager (ABI) will provide • 5x more frequent scans (5 minute for full disk, 30 second refresh for single mesoscale sector), • 4x improved temporal resolution (2 km at sub-satellite point, except 0.5 km visible), and • 3x more spectral channels (16 total, including 4 in the near-IR and 10 in the IR) than currently on GOES-13/14/15 (N/O/P) • An optical sensor on the Geostationary Lightning Mapper (GLM) will provide continuous lightning flash rates • No Sounder
Images from Weather Event Simulator (WES) case available to NWS sites
GOES-R Proving Ground • A proving ground is designed to showcase future capabilities and identify possible gaps as a forward-thinking exercise to prepare the end user for upcoming science and technology and assure that the capabilities meet user requirements. • The GOES-R Proving Ground is a collective effort between many NOAA and NOAA-supported agencies and universities. • The primary customer is the National Weather Service. • To assure widespread evaluation and readiness across the NWS, the GOES-R Proving Ground is leveraging existing testbeds at the National Centers, and starting new ones where they do not exist, as well as hiring “satellite champions”. • NWS Weather Forecast Offices can participate in the Proving Ground because all imagery and products are formatted for AWIPS, N-AWIPS, and eventually AWIPS II.
GOES-R Proving Ground • CIMSS supports over 70 NWS sites across the country. http://cimss.ssec.wisc.edu/goes_r/proving-ground/SPC/SPC.html
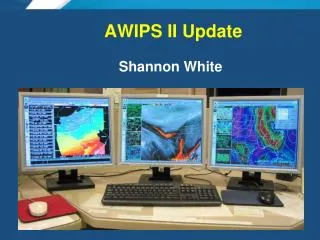
AWIPS “I” (1998 to 2011) • Advanced Weather Interactive Processing System • Modular, discretized architecture • Numerous components, each of which was essentially standalone and responsible for a different function • Different decoder for each ingest data type; netCDF3 data store • Display Two-Dimensions (D2D), graphical frontend • Notification server and purge process • Built specifically for National Weather Service multiple server, multiple workstation hardware configuration • Predominantly C and FORTRAN code, with some Tcl for GUI • Flat text, pipe-delimited localization files • Basic visualization functionality • Not community software with source code generally not available, even at NWS field offices
AWIPS “II” (2012+) • Service-oriented, client-server architecture, plug-in enabled • Two primary components which can standalone • Environmental Data EXchange (EDEX); HDF5 data store • Common AWIPS Visualization Environment (CAVE) • Code arranged in object-oriented Java design • Scalable to multiple platforms, computing systems • Some C and FORTRAN used to optimized performance • Configuration through eXtensible Markup Language (XML) and Python with numpy • Employs shader language for on-GPU calculations • Raytheon-developed code is non-proprietary with unlimited Government purpose rights and eventually will be available to the community through Unidata • EDEX has McIDAS AREA ingest capability for satellite data
The Challenge:Assuring CIMSS products are available in AWIPS “II”
The Roadmap GOES-R Launch New functionality New configuration New data distribution format
Data Fusion • Data fusion is a methodology current under investigation by NWS OST as a way to solve future information overload by combining different data sets into a more complete, actionable product than any one component separately • Some GOES-R Algorithm Working Group (AWG) products are already considered fused because they use model output in addition to satellite observations from multiple bands • If the users are unfamiliar with the inputs into the fused product, misinterpretation of results and underestimate of error may result • Data fusion can appear more absolute than it is • AWIPS II is the ideal tool for data fusion because it can quickly combine disparate data types into a single product and allow for interrogation of original components • Data fusion should be user developed and controlled
Example: Low Cloud Ceiling Probability • GOES-R participation in testbeds has indicated that forecasters are interested in evaluating components to assess magnitude, error, and probability rather than a single deterministic solution • Convective initiation product • Interest in cooling rate as an indicator of realized buoyancy • Trend toward model blends and ensembles • Evaluating the envelope of solutions • This summer, NWS Sullivan evaluated the GOES-R AWG Low Cloud Ceiling Probability products, created with existing bands on GOES-East and GOES-West for every scan • Developed by Mike Pavolonis and Corey Calvert • Daytime fog probability is a function of the spatial uniformity of the 11 μm brightness temperature of the clouds, the temperature difference between the cloud and the surface, and the modeled RH • Nighttime fog probability is a function of cloud emissivity at 3.9 μm, the temperature difference between the cloud and the surface, and the modeled RH
Example: AWG MVFR Probability (Day) The probability of MVFR product reports the probability that the cloud ceiling is < 3000 feet, regardless of surface visibility.
Example: AWG IFR Probability (Day) The probability of IFR product reports the probability that the cloud ceiling is < 1000 feet, regardless of surface visibility.
RGB/RGBA Image Compositing • In order to maximize the use of current and future satellite imagery and products, as well as the software display, it is necessary to integrate and support a flexible bit depth data format and user-driven three-way or four-way (with an alpha channel) image blending functionality into the AWIPS II software. • This would leverage a red-green-blue-alpha (RGBA) capability in pre-release versions of the migrated software. • The implementation of a data format and display system allowing for bit depths greater than the current specification has numerous applications useful to operational weather analysis and forecasting beyond current capabilities and techniques. • To support data fusion, image differences, individual bands, and other band manipulations can be assigned to a color in the RGB triplet. RGB products are currently undergoing evaluation at the Hydromet Prediction Center and National Hurricane Center.
Simulated ABI Longwave Bands • Bands 8 through 16 are produced from the National Severe Storms Laboratory (NSSL) Weather Research and Forecast (WRF) model output. • CompactOPTRAN computes optical depths at each model layer based on temperature and water vapor mixing ratio. • 36-hour simulation at 4 km spatial resolution is started once per day at 00 UTC, with imagery available by 12 UTC. • Currently limited distribution in AWIPS and N-AWIPS to select NWS forecast offices and National Centers. • Output available online at • http://www.nssl.noaa.gov/wrf/ • with imagery at • http://cimss.ssec.wisc.edu/goes_r/proving-ground/nssl_abi/nssl_abi_rt.html
Simulated ABI Band 8 (6.19 µm) Weighting function for US Standard profile indicates sensitivity to upper tropospheric moisture
Simulated ABI Band 9 (6.95 µm) Weighting function for US Standard profile indicates sensitivity to upper middle tropospheric moisture
Simulated ABI Band 10 (7.34 µm) Weighting function for US Standard profile indicates sensitivity to lower middle tropospheric moisture
Building an RGB: Band 8 – Band 10 Red with alpha gradient (upper – lower tropospheric moisture different), white with alpha gradient (clouds)
Simulated ABI Band 12 (9.61 µm) Weighting function for US Standard profile indicates sensitivity to ozone
Building an RGB: Band 12 – Band 13 Green with alpha gradient (brighter high ozone concentration indicative of lower potential vorticity surfaces)
Building an RGB: Band 8 Inverted Blue with alpha gradient (brighter blues indicate dryer upper tropospheric air, dry slot)
Building an RGB: Composite Composite clearly indicates trough over western United States, dry slot, and differential tropospheric moisture
Potential AWIPS II Capabilities • User interface for the multi-channel RGB color capability • Implement with GPU Shader Language for quick display time • Updated user controls and color scheme selection • New color table widget for developing color tables with more than 256 colors (current AWIPS I transmission format and software limitation) • Product browser capability (Raytheon concept) • Redesign the volume browser? • Expanded capability for derived parameters • User control of image differencing and scaling • Permit operations in value space instead of data storage space • EDEX plug-in to handle ingest of GOES-R sectorized CMI products in netCDF4 • CAVE plug-in for displaying bit depths greater than 8 • Additional configurability via XML • Legends, scaling, etc.
Example: Raytheon’s Product Browser CIMSS Real-time Mesoscale Analysis (CRTMA) using MODIS SST composite
Delivery Mechanisms Today, Tomorrow • NOAAPort: This year, the delivery bandwidth increased from 10 Mbps to 30 Mbps. NOAAPortwill remain the primary delivery mechanism through at least 2013. (Source: Brian Gockel, NWS OST SEC) • Increased bandwidth will accommodate transmission of dual-polarization radar data, bias-corrected SREF, other NCEP model output, and new satellite imagery/products from polar orbiters (NPP) over the next two years. • LDM: The LDM will facilitate the raw data ingest from NOAAPort into AWIPS II (no longer confined to the LDAD), such that terrestrial data delivery could be a strong candidate without significant retooling if sufficient Internet bandwidth exists at field offices. • Repository: “Push-pull” and “on-request” technology has been investigated as a way to deliver weather data to remote locations (AWIPS II Thin Client), and could be expanded to alleviate NOAAPort bandwidth for regional data and products. • Use regional headquarters as hubs to receive GOES-R broadcast? • Web mapping services (WMS) framework to geographically partition data?
Conclusions and Future Directions • The GOES-R Proving Ground is advancing the use of satellite imagery in operational meteorology. • AWIPS II will play a significant role in promoting the capabilities of GOES-R and new polar-orbiting satellites (NPP) because the expanded distribution and development group will lead to an implementation of additional features which maximize the utility of satellite imagery and products in concert with other in-situ observations and model output. • Blended and combined products • It will also allow for the efficient transfer of new science and technology into NWS operations without delay. • To accomplish this, we will have to investigate and utilize delivery mechanisms outside of NOAAPort, such as LDM
Conclusions and Future Directions • Our future AWIPS will not be confined to NWS offices, but extend to universities and become an integral part of the increasing research to operations activities. • Unique applications of the software will increase • Now is the time to start investigating data overload, and developing methodology which optimizes the use of data, imagery, products, and tools which are situation and scenario relevant, and leads the decision support thought process. • Too focused situational awareness decreases overall awareness • Don’t let data fusion become data confusion Questions? Comments? Contact me: Jordan Gerth, Jordan.Gerth@noaa.gov