Download
1 / 1
10 likes | 143 Views
DNA Microarrays: A guide to teaching chips. SHY idh1 Mhp SHY Mhp. 120 ng/ul. SHY idh1 Mhp SHY Mhp. 240 ng/ul. SHY-O SHY-O Mhp-O. Mhp-O idh1-O idh1-O. RT-C RT-C.

E N D
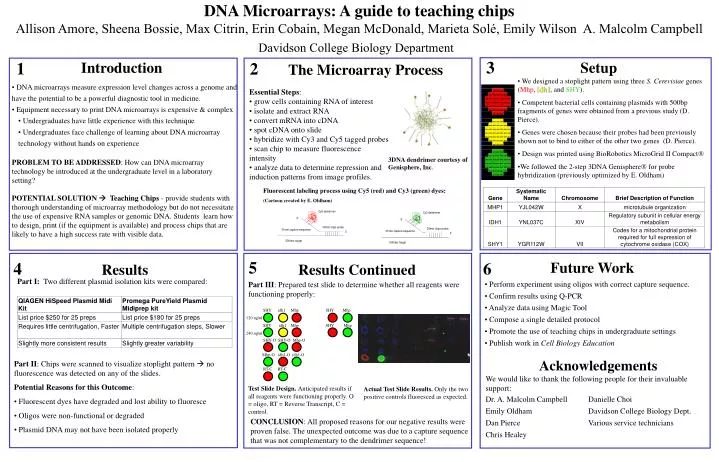
DNA Microarrays: A guide to teaching chips SHY idh1 Mhp SHY Mhp 120 ng/ul SHY idh1 Mhp SHY Mhp 240 ng/ul SHY-O SHY-O Mhp-O Mhp-O idh1-O idh1-O RT-C RT-C Allison Amore, Sheena Bossie, Max Citrin, Erin Cobain, Megan McDonald, Marieta Solé, Emily Wilson A. Malcolm Campbell Davidson College Biology Department 3 1 2 Introduction Setup The Microarray Process • We designed a stoplight pattern using three S. Cerevisiae genes (Mhp, Idh1, and SHY). • Competent bacterial cells containing plasmids with 500bp fragments of genes were obtained from a previous study (D. Pierce). • Genes were chosen because their probes had been previously shown not to bind to either of the other two genes (D. Pierce). • Design was printed using BioRobotics MicroGrid II Compact • We followed the 2-step 3DNA Genisphere for probe hybridization (previously optimized by E. Oldham) • DNA microarrays measure expression level changes across a genome and have the potential to be a powerful diagnostic tool in medicine. • Equipment necessary to print DNA microarrays is expensive & complex • Undergraduates have little experience with this technique • Undergraduates face challenge of learning about DNA microarray technology without hands on experience • PROBLEM TO BE ADDRESSED: How can DNA microarray technology be introduced at the undergraduate level in a laboratory setting? • POTENTIAL SOLUTION Teaching Chips - provide students with thorough understanding of microarray methodology but do not necessitate the use of expensive RNA samples or genomic DNA. Students learn how to design, print (if the equipment is available) and process chips that are likely to have a high success rate with visible data. • Essential Steps: • grow cells containing RNA of interest • isolate and extract RNA • convert mRNA into cDNA • spot cDNA onto slide • hybridize with Cy3 and Cy5 tagged probes • scan chip to measure fluorescence intensity • analyze data to determine repression and induction patterns from image profiles. 3DNA dendrimer courtesy of Genisphere, Inc. Fluorescent labeling process using Cy5 (red) and Cy3 (green) dyes: (Cartoon created by E. Oldham) 5 4 6 Future Work Results Results Continued Part I: Two different plasmid isolation kits were compared: • Perform experiment using oligos with correct capture sequence. • Confirm results using Q-PCR • Analyze data using Magic Tool • Compose a single detailed protocol • Promote the use of teaching chips in undergraduate settings • Publish work in Cell Biology Education Part III: Prepared test slide to determine whether all reagents were functioning properly: Acknowledgements • Part II: Chips were scanned to visualize stoplight pattern no fluorescence was detected on any of the slides. • Potential Reasons for this Outcome: • Fluorescent dyes have degraded and lost ability to fluoresce • Oligos were non-functional or degraded • Plasmid DNA may not have been isolated properly We would like to thank the following people for their invaluable support: Dr. A. Malcolm Campbell Danielle Choi Emily Oldham Davidson College Biology Dept. Dan Pierce Various service technicians Chris Healey Test Slide Design. Anticipated results if all reagents were functioning properly. O = oligo, RT = Reverse Transcript, C = control. Actual Test Slide Results. Only the two positive controls fluoresced as expected. CONCLUSION: All proposed reasons for our negative results were proven false. The unexpected outcome was due to a capture sequence that was not complementary to the dendrimer sequence!


