Download
1 / 32
320 likes | 339 Views
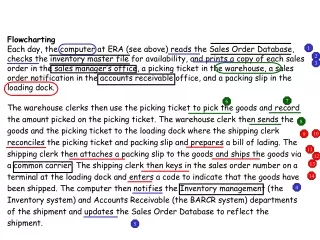
Introduction to Flowcharting. Computer Science Principles 2013-2014 ASFA. START. END. Display message “ How many hours did you work? ”. Display message “ How much do you get paid per hour? ”. Read Hours. Read PayRate. Multiply Hours by PayRate. Store result in GrossPay.

E N D
Introduction to Flowcharting Computer Science Principles 2013-2014 ASFA
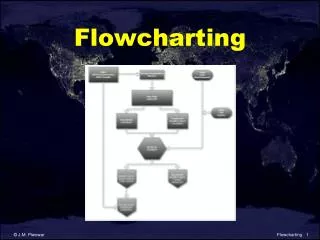
START END Display message “How many hours did you work?” Display message “How much do you get paid per hour?” Read Hours Read PayRate Multiply Hours by PayRate. Store result in GrossPay. Display GrossPay What is a Flowchart? • A flowchart is a diagram that depicts the “flow” of a program. • The figure shown here is a flowchart for the pay-calculating program shown in Program 1-1.
START END Display message “How many hours did you work?” Display message “How much do you get paid per hour?” Read Hours Read PayRate START END Display GrossPay Terminal Basic Flowchart Symbols • Terminals • represented by rounded rectangles • indicate a starting or ending point Multiply Hours by PayRate. Store result in GrossPay. Terminal
START END Display message “How many hours did you work?” Display message “How much do you get paid per hour?” Read Hours Read PayRate Display message “How many hours did you work?” Read Hours Display GrossPay Basic Flowchart Symbols • Input/Output Operations • represented by parallelograms • indicate an input or output operation Input/Output Operation Multiply Hours by PayRate. Store result in GrossPay.
START END Display message “How many hours did you work?” Display message “How much do you get paid per hour?” Read Hours Read PayRate Display GrossPay Basic Flowchart Symbols • Processes • represented by rectangles • indicates a process such as a mathematical computation or variable assignment Multiply Hours by PayRate. Store result in GrossPay. Process Multiply Hours by PayRate. Store result in GrossPay.
Four Flowchart Structures • Sequence • Decision • Repetition • Case
Sequence Structure • A series of actions are performed in sequence • The pay-calculating example was a sequence flowchart.
NO YES x < y? Calculate a as x times 2. Calculate a as x plus y. Decision Structure • The flowchart segment below shows how a decision structure is expressed in C++ as an if/else statement. Flowchart C++ Code if (x < y) a = x * 2; else a = x + y;
NO YES x < y? Calculate a as x times 2. Decision Structure • The flowchart segment below shows a decision structure with only one action to perform. It is expressed as an if statement in C++ code. Flowchart C++ Code if (x < y) a = x * 2;
YES x < y? Add 1 to x Repetition Structure • The flowchart segment below shows a repetition structure expressed in C++ as a while loop. Flowchart C++ Code while (x < y) x++;
YES x < y? Display x Controlling a Repetition Structure • The action performed by a repetition structure must eventually cause the loop to terminate. Otherwise, an infinite loop is created. • In this flowchart segment, x is never changed. Once the loop starts, it will never end. • QUESTION: How can thisflowchart be modified soit is no longer an infiniteloop?
YES x < y? Display x Add 1 to x Controlling a Repetition Structure • ANSWER: By adding an action within the repetition that changes the value of x.
CASEyears_employed 1 3 Other 2 bonus = 100 bonus = 400 bonus = 800 bonus = 200 Case Structure If years_employed = 2, bonus is set to 200 If years_employed = 3, bonus is set to 400 If years_employed is any other value, bonus is set to 800 If years_employed = 1, bonus is set to 100
START END A A Connectors • The “A” connector indicates that the second flowchart segment begins where the first segment ends.
START Read Input. Call calc_pay function. Display results. END Modules • The position of the module symbol indicates the point the module is executed. • A separate flowchart can be constructed for the module.
NO YES x > min? NO YES Display “x is outside the limits.” x < max? Display “x is outside the limits.” Display “x is within limits.” Combining Structures • This flowchart segment shows two decision structures combined.
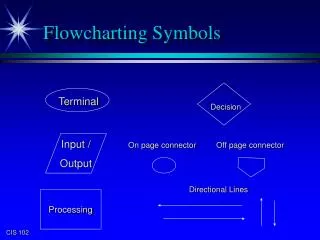
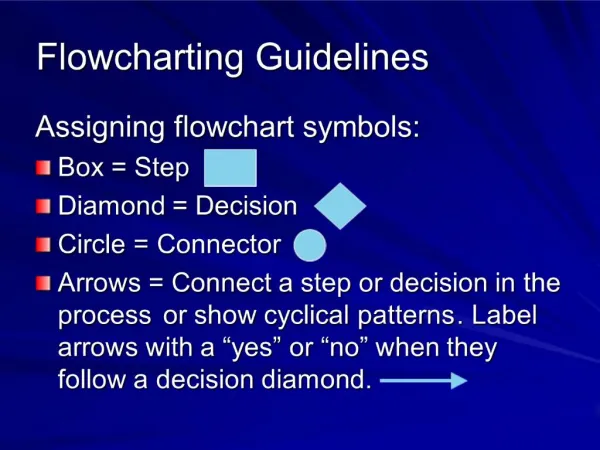
Review • What do each of the following symbols represent? (Answer on next slide)
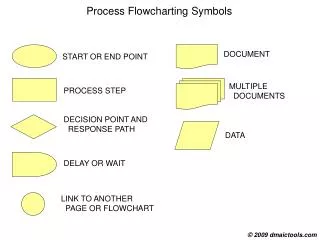
Answer • What do each of the following symbols represent? Decision Terminal Input/Output Operation Connector Module Process
Review • Name the four flowchart structures. (Answer on next slide)
Answer • Sequence • Decision • Repetition • Case
Review • What type of structure is this? (Answer on next slide)
Answer • Repetition
Review • What type of structure is this? (Answer on next slide)
Answer • Sequence
Review • What type of structure is this? (Answer on next slide)
Answer • Case
Review • What type of structure is this? (Answer on next slide)
Answer • Decision