Download
1 / 51
530 likes | 636 Views
Introduction to Flowcharting. A Supplement to Starting Out with C++: From Control Structures to Objects 5th Edition by Tony Gaddis Published by Addison-Wesley. START. END. Display message “How many hours did you work?”. Display message “How much do you get paid per hour?”. Read Hours.

E N D
Introduction to Flowcharting A Supplement toStarting Out with C++: From Control Structures to Objects 5th Editionby Tony GaddisPublished by Addison-Wesley
START END Display message “How many hours did you work?” Display message “How much do you get paid per hour?” Read Hours Read PayRate Multiply Hours by PayRate. Store result in GrossPay. Display GrossPay What is a Flowchart? • A flowchart is a diagram that depicts the “flow” of a program. • The figure shown here is a flowchart for the pay-calculating program shown in Program 1-1.
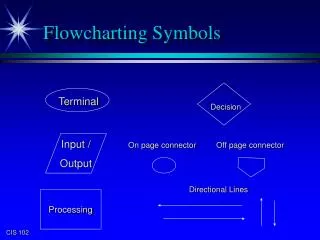
START END Display message “How many hours did you work?” Display message “How much do you get paid per hour?” Read Hours Read PayRate Display GrossPay Rounded Rectangle Basic Flowchart Symbols • Notice there are three types of symbols in this flowchart: • rounded rectangles • parallelograms • a rectangle • Each symbol represents a different type of operation. Parallelogram Multiply Hours by PayRate. Store result in GrossPay. Rectangle Rounded Rectangle
START END Display message “How many hours did you work?” Display message “How much do you get paid per hour?” Read Hours Read PayRate START END Display GrossPay Terminal Basic Flowchart Symbols • Terminals • represented by rounded rectangles • indicate a starting or ending point Multiply Hours by PayRate. Store result in GrossPay. Terminal
START END Display message “How many hours did you work?” Display message “How much do you get paid per hour?” Read Hours Read PayRate Display message “How many hours did you work?” Read Hours Display GrossPay Basic Flowchart Symbols • Input/Output Operations • represented by parallelograms • indicate an input or output operation Input/Output Operation Multiply Hours by PayRate. Store result in GrossPay.
START END Display message “How many hours did you work?” Display message “How much do you get paid per hour?” Read Hours Read PayRate Display GrossPay Basic Flowchart Symbols • Processes • represented by rectangles • indicates a process such as a mathematical computation or variable assignment Multiply Hours by PayRate. Store result in GrossPay. Process Multiply Hours by PayRate. Store result in GrossPay.
START END Display message “How many hours did you work?” Display message “How much do you get paid per hour?” Read Hours Read PayRate Display GrossPay Stepping Through the Flowchart Stepping Through the Flowchart In the next seven slides we will step through each symbol in the flowchart. We will show the program output and the contents of the variables. Multiply Hours by PayRate. Store result in GrossPay. Variable Contents: Hours: ? PayRate: ? GrossPay: ?
START END Display message “How many hours did you work?” Display message “How much do you get paid per hour?” Read Hours Read PayRate Display GrossPay Stepping Through the Flowchart Step 1: An Output Operation Stepping Through the Flowchart Screen Output How many hours did you work? Multiply Hours by PayRate. Store result in GrossPay. Variable Contents: Hours: ? PayRate: ? GrossPay: ?
START END Display message “How many hours did you work?” Display message “How much do you get paid per hour?” Read Hours Read PayRate Display GrossPay Stepping Through the Flowchart Stepping Through the Flowchart Step 2: An Input Operation (User types 40) How many hours did you work? 40 Multiply Hours by PayRate. Store result in GrossPay. Variable Contents: Hours: 40 PayRate: ? GrossPay: ? The value 40 is stored in Hours.
START END Display message “How many hours did you work?” Display message “How much do you get paid per hour?” Read Hours Read PayRate Display GrossPay Stepping Through the Flowchart Stepping Through the Flowchart Screen Output How much do you get paid per hour? Step 3: An Output Operation Multiply Hours by PayRate. Store result in GrossPay. Variable Contents: Hours: 40 PayRate: ? GrossPay: ?
START END Display message “How many hours did you work?” Display message “How much do you get paid per hour?” Read Hours Read PayRate Display GrossPay Stepping Through the Flowchart Stepping Through the Flowchart How much do you get paid per hour? 20 Step 4: Input Operation (User types 20) Multiply Hours by PayRate. Store result in GrossPay. Variable Contents: Hours: 40 PayRate: 20 GrossPay: ? The value 20 is stored in PayRate.
START END Display message “How many hours did you work?” Display message “How much do you get paid per hour?” Read Hours Read PayRate Display GrossPay Stepping Through the Flowchart How much do you get paid per hour? 20 Step 5: The product of Hours times PayRate is stored in GrossPay Multiply Hours by PayRate. Store result in GrossPay. Variable Contents: Hours: 40 PayRate: 20 GrossPay: 800 The value 800 is stored in GrossPay.
START END Display message “How many hours did you work?” Display message “How much do you get paid per hour?” Read Hours Read PayRate Display GrossPay Stepping Through the Flowchart Screen Output Your gross pay is 800 Multiply Hours by PayRate. Store result in GrossPay. Variable Contents: Hours: 40 PayRate: 20 GrossPay: 800 Step 6: An Output Operation
Four Flowchart Structures • Sequence • Decision • Repetition • Case
Sequence Structure • A series of actions are performed in sequence • The pay-calculating example was a sequence flowchart.
Decision Structure • One of two possible actions is taken, depending on a condition.
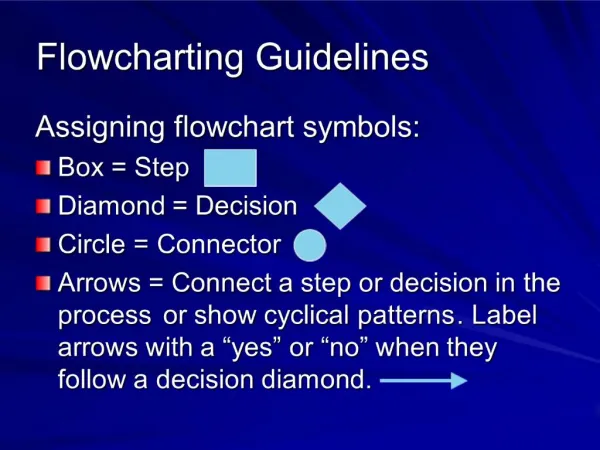
NO YES Decision Structure • A new symbol, the diamond, indicates a yes/no question. If the answer to the question is yes, the flow follows one path. If the answer is no, the flow follows another path
NO YES x < y? Process A Process B Decision Structure • In the flowchart segment below, the question “is x < y?” is asked. If the answer is no, then process A is performed. If the answer is yes, then process B is performed.
NO YES x < y? Calculate a as x times 2. Calculate a as x plus y. Decision Structure • The flowchart segment below shows how a decision structure is expressed in C++ as an if/else statement. Flowchart C++ Code if (x < y) a = x * 2; else a = x + y;
NO YES x < y? Calculate a as x times 2. Decision Structure • The flowchart segment below shows a decision structure with only one action to perform. It is expressed as an if statement in C++ code. Flowchart C++ Code if (x < y) a = x * 2;
Repetition Structure • A repetition structure represents part of the program that repeats. This type of structure is commonly known as a loop.
Repetition Structure • Notice the use of the diamond symbol. A loop tests a condition, and if the condition exists, it performs an action. Then it tests the condition again. If the condition still exists, the action is repeated. This continues until the condition no longer exists.
YES x < y? Process A Repetition Structure • In the flowchart segment, the question “is x < y?” is asked. If the answer is yes, then Process A is performed. The question “is x < y?” is asked again. Process A is repeated as long as x is less than y. When x is no longer less than y, the repetition stops and the structure is exited.
YES x < y? Add 1 to x Repetition Structure • The flowchart segment below shows a repetition structure expressed in C++ as a while loop. Flowchart C++ Code while (x < y) x++;
YES x < y? Display x Controlling a Repetition Structure • The action performed by a repetition structure must eventually cause the loop to terminate. Otherwise, an infinite loop is created. • In this flowchart segment, x is never changed. Once the loop starts, it will never end. • QUESTION: How can thisflowchart be modified soit is no longer an infiniteloop?
YES x < y? Display x Add 1 to x Controlling a Repetition Structure • ANSWER: By adding an action within the repetition that changes the value of x.
YES x < y? Display x Add 1 to x A Pre-Test Repetition Structure • This type of structure is known as a pre-test repetition structure. The condition is tested BEFORE any actions are performed.
YES x < y? Display x Add 1 to x A Pre-Test Repetition Structure • In a pre-test repetition structure, if the condition does not exist, the loop will never begin.
x < y? Display x Add 1 to x YES A Post-Test Repetition Structure • This flowchart segment shows a post-testrepetition structure. • The condition is tested AFTER the actionsare performed. • A post-test repetition structure alwaysperforms its actions at least once.
x < y? Display x Add 1 to x YES A Post-Test Repetition Structure • The flowchart segment below shows a post-test repetition structure expressed in C++ as a do-while loop. C++ Code do{ cout << x << endl; x++;} while (x < y); Flowchart
Case Structure • One of several possible actions is taken, depending on the contents of a variable.
CASEyears_employed 1 3 Other 2 bonus = 100 bonus = 400 bonus = 800 bonus = 200 Case Structure • The structure below indicates actions to perform depending on the value in years_employed.
CASEyears_employed 1 3 Other 2 bonus = 100 bonus = 400 bonus = 800 bonus = 200 Case Structure If years_employed = 2, bonus is set to 200 If years_employed = 3, bonus is set to 400 If years_employed is any other value, bonus is set to 800 If years_employed = 1, bonus is set to 100
A Connectors • Sometimes a flowchart will not fit on one page. • A connector (represented by a small circle) allows you to connect two flowchart segments.
START END A A Connectors • The “A” connector indicates that the second flowchart segment begins where the first segment ends.
Modules • A program module (such as a function in C++) is represented by a special symbol.
START Read Input. Call calc_pay function. Display results. END Modules • The position of the module symbol indicates the point the module is executed. • A separate flowchart can be constructed for the module.
YES x < y? Display x Add 1 to x Combining Structures • Structures are commonly combined to create more complex algorithms. • The flowchart segment below combines a decision structure with a sequence structure.
NO YES x > min? NO YES Display “x is outside the limits.” x < max? Display “x is outside the limits.” Display “x is within limits.” Combining Structures • This flowchart segment shows two decision structures combined.
Review • What do each of the following symbols represent? (Answer on next slide)
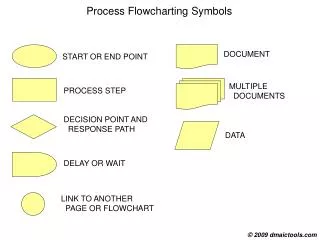
Answer • What do each of the following symbols represent? Decision Terminal Input/Output Operation Connector Module Process
Review • Name the four flowchart structures. (Answer on next slide)
Answer • Sequence • Decision • Repetition • Case
Review • What type of structure is this? (Answer on next slide)
Answer • Repetition
Review • What type of structure is this? (Answer on next slide)
Answer • Sequence
Review • What type of structure is this? (Answer on next slide)
Answer • Case
Review • What type of structure is this? (Answer on next slide)