Download

1 / 31
360 likes | 488 Views
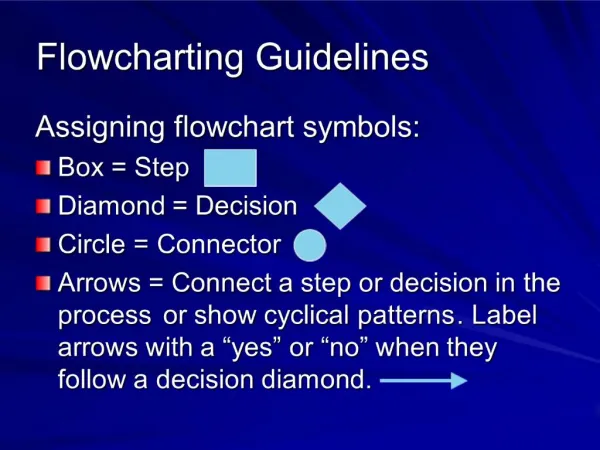
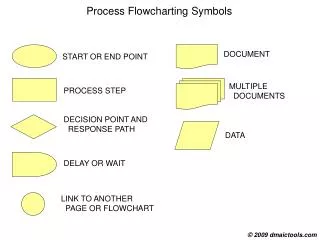
Introduction To Flowcharting. by Jumail Bin Taliba Faculty of Computer Science & Information System. Today’s Topics. Flowchart Symbols Control Structures Some examples. Flowchart: Represents an algorithm in graphical symbols Example: Algorithm for multiplying two numbers.

E N D
Introduction To Flowcharting by Jumail Bin Taliba Faculty of Computer Science & Information System
Today’s Topics • Flowchart Symbols • Control Structures • Some examples
Flowchart: Represents an algorithm in graphical symbols Example: Algorithm for multiplying two numbers
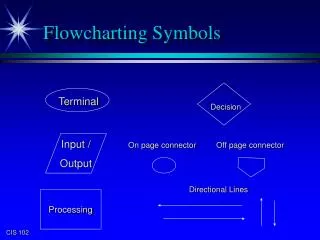
Start Terminal. Program starts here Stop Terminal Program ends here Input. Enter values for A and B Process Output Example:
Connectors on the same page 1- connection on the same flowchart portion 2- connection on the different flowchart portion
Connectors on a different page Page 2 Page 1
The detail of how the function works is put in another flowchart. This is known as Function-Definition Page 1 Start terminal for a Function is different. Do not use “Start” Page 2 Body of a function is the same with normal flowchart At this point, we only focus on what to do. How to do it, it comes later. This part is known as Function-Call End terminal must be a “Return” Function This flowchart calculates the average of three numbers
Parameters used in a function-definition are called formal parameters R, a, b, c are formal parameters Page 1 Page 2 AVRG is the function name Objects enclosed by ( ) – result, n1, n2, n3- are called parameters • Each formal parameter represents • an actual parameter according • to its order: • R represents result, • a represents n1, • b represents n2, • c represents n3 • The name of an actual parameter may be • different from its formal parameter Parameters used in a function-call are called actual parameters result, n1, n2, n3 are actual parameters Related terms and concepts This flowchart calculates the average of three numbers
Page 1 Page 2 This is wrong! n1, n2, n3 are actual parameters. Should use a, b, c instead. This is wrong! R is an formal parameters. Should use result instead. Related terms and concepts (cont.) In a function-definition, you should only use formal parameters – R, a, b, c You shouldn’t use actual parameters
Page 2 A function may be called more than once At this time: R represents average1, a represents n1, b represents n2, c represents n3 When comes to this: R represents average2, a represents n4, b represents n5, c represents n6 Related terms and concepts (cont.) Page 1 This flowchart calculates the average of three numbers
Related terms and concepts (cont.) • A function parameter may act as: • Input • Data of the function • Output • The result of the function • Both
Function definition: R is the output parameter a, b, c are input parameters Page 1 Page 2 Function call: result is the output parameter. n1, n2, n3 are the input parameters. Related terms and concepts (cont.) This flowchart calculates the average of three numbers
Function definition: x and y act as both input and output parameters Function call: p and q act as both input and output parameters. Related terms and concepts (cont.) Page 1 Page 2 This flowchart exchanges or swaps the value of x and y each other
Page 2 Page 2 The output parameter (R) is removed from the formal parameter list and the result is return Related terms and concepts (cont.) If there is only one output parameter, the flowchart may “RETURN” the result Example: let take a look again at the function that calculates the average of three numbers. Original function flowchart: Since it has only one output, the output is “RETURN”
Page 1 Page 1 Now, resultis not anymore a parameter of the function-call Related terms and concepts (cont.) Since the function flowchart has been modified, the way of the function to be called will also be changed Original main flowchart: Modified main flowchart:
Control Structure • Describe the flow of execution. • In flowcharts, flow of execution is represented by the arrow line. • Types of control structure: • Sequential • Selection • Repetition
A statement means a command or an instruction statement Sequential Structure Multiple statements considered as one statement statement statement
TRUE statement Selection Structure If (one-choice) “do it or don’t” condition condition FALSE statement ° If set condition is true, execute the statement, else do nothing
Selection Structure (cont..) statement If-else(two-choices) “do this one or the other one” TRUE condition FALSE condition Statement 1 Statement 2 ° If set condition is true, execute the first statement, else execute second statement
Selection Structure (cont..) FALSE test1 FALSE test1 TRUE TRUE FALSE test2 ° ° TRUE statement ° Considered as one statement ° it is an “one-choice” if Nested if(if within if)
Selection Structure (cont..) Complex if-else & if Statements x FALSE condition TRUE statement TRUE statement condition FALSE statement ° ° Considered as one statement
Repetition Structure condition body of loop statement while Loop It is a pre-testloop ° condition FALSE TRUE While a set condition is true, repeat statement (body of loop)
Repetition Structure (cont…) statement do-while Loop It is a post-test loop ° statement condition TRUE FALSE Do the statement (body of loop) while a condition is true
Repetition Control Structure (cont…) for LoopIt is a pre-test loop x initialization ° FALSE condition TRUE body of loop increment y
Input: Length <- 5 Width <- 3 Process: Area = 5 * 3 = 15 Process: Perimeter = 2* (5+3) = 16 Output Area: 15 Perimeter: 16 Example:
Input: Num <- 10 Enter a Number >> 10 Num = 10 10 > 0 ? => YES Output: “Category A” Example: What is the output of the following flowchart when the input Num= 10 Category A
Input: Num <- 0 Enter a Number >> 0 Num = 0 0 > 0 ? => NO Output: “Category B” Output: “Category A” Example: What is the output of the following flowchart when the input is Num= 0 Category B Category A
Variables (in memory): • Num [ 4 ] • Result [ ] • Count [ ] Input: Num <- 4 Enter a Number => 4 Count = 3 3 > 0 ? => YES Count = 1 1 > 0 ? => YES Count = 4 4 > 0 ? => YES Count = 2 2 > 0 ? => YES Count = 0 0 > 0 ? => NO Example: What is the output of the following flowchart when the input is Num= 4 • Variables (in memory): • Num [ 4 ] • Result [ 0 ] • Count [ 4 ] • Variables (in memory): • Num [ 4 ] • Result [ 7 ] 4 + 3 • Count [ 2 ] 3 - 1 • Variables (in memory): • Num [ 4 ] • Result [ 9 ] 7 + 2 • Count [ 1 ] 2 - 1 • Variables (in memory): • Num [ ] • Result [ ] • Count [ ] • Variables (in memory): • Num [ 4 ] • Result [ 10] 9 + 1 • Count [ 0 ] 1 - 1 • Variables (in memory): • Num [ 4 ] • Result [ 4 ] 0 + 4 • Count [ 3 ] 4 - 1 Count: 4 Count: 3 Count: 2 Count: 1 Count: 0 Result: 10
10 5 average N=6 Sum = 10 + 5 + 6 average = 21/3 Output: Average: 7 Example: What is the output of the following flowchart when the input is N = 6 Page 1 Page 2