Download
1 / 12
140 likes | 256 Views
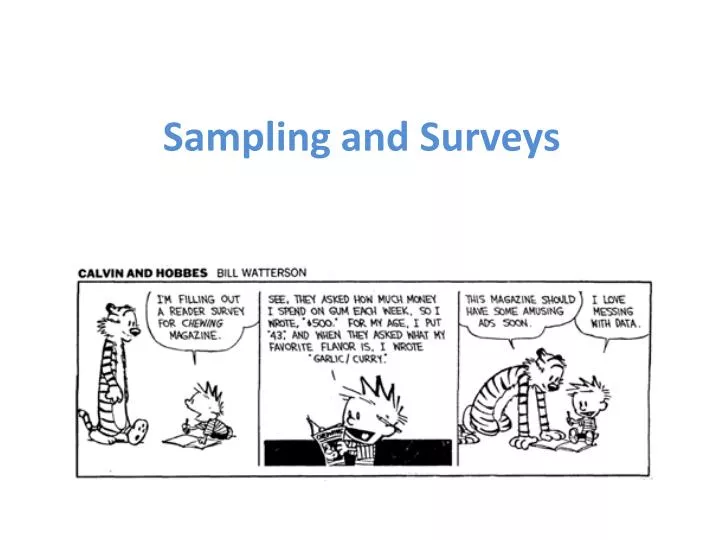
Sampling and Surveys. Activity : See no evil, hear no evil?. Confucuis once said, “I hear and I forget. I see and I remember. I do and I understand.” Do people really remember what they see better than what they hear?. Population and Sample

E N D
Activity: See no evil, hear no evil? Confucuis once said, “I hear and I forget. I see and I remember. I do and I understand.” Do people really remember what they see better than what they hear?
Population and Sample • The distinction between population and sample is basic to statistics. To make sense of any sample result, you must know what population the sample represents Definition: The populationin a statistical study is the entire group of individuals about which we want information. A sampleis the part of the population from which we actually collect information. We use information from a sample to draw conclusions about the entire population. Collect data from a representative Sample... Population Sample Make an Inference about the Population.
Example The K-State governing board wants to survey KSU students about their mode of transportation to campus. From the KSU directory, the governing board randomly selects 150 K-State students to survey. Identify the population and the sample:
The Idea of a Sample Survey • We often draw conclusions about a whole population on the basis of a sample. • Choosing a sample from a large, varied population is not that easy. Step 1: Define the population we want to describe. Step 2: Say exactly what we want to measure. A “sample survey” is a study that uses an organized plan to choose a sample that represents some specific population. Step 3: Decide how to choose a sample from the population.
How to Sample Badly How can we choose a sample that we can trust to represent the population? There are a number of different methods to select samples. Definition: The design of a statistical study shows bias if it systematically favors certain outcomes. Convenience sample: Choosing individuals who are easiest to reach Convenience samples often produce unrepresentative data…why?
How to Sample Badly • Convenience samples are almost guaranteed to show bias. So are voluntary response samples, in which people decide whether to join the sample in response to an open invitation. Voluntary response sample: consists of people who choose themselves by responding to a general appeal. Television news programs encourage viewers to go to a website and “vote” yes or no on some issue. The commentator would then announce the results of the survey. Voluntary response samples show bias because people with strong opinions (often in the same direction) are most likely to respond.
How to Sample Well: Random Sampling • The statistician’s remedy is to allow impersonal chance to choose the sample. A sample chosen by chance rules out both favoritism by the sampler and self-selection by respondents. • Random sampling, the use of chance to select a sample, is the central principle of statistical sampling. Definition: A simple random sample (SRS) of size n consists of n individuals from the population chosen in such a way that every set of n individuals has an equal chance to be the sample actually selected. In practice, people use random numbers generated by a computer or calculator to choose samples. If you don’t have technology handy, you can use a table of random digits.
SRS (Simple Random Sample) • Advantages • Unbiased • Easy • Disadvantages • Large variance • May not be representative • Must identify whole population
How to Choose an SRS • Definition: • A table of random digits is a long string of the digits 0, 1, 2, 3, 4, 5, 6, 7, 8, 9 with these properties: • • Each entry in the table is equally likely to be any of the 10 digits 0 - 9. • • The entries are independent of each other. That is, knowledge of one part of the table gives no information about any other part. How to Choose an SRS Using Table D Step 1: Label. Give each member of the population a numerical label of the same length. Step 2: Table. Read consecutive groups of digits of the appropriate length from Table D. Your sample contains the individuals whose labels you find.
Example: How to Choose an SRS • Problem: Use Table D at line 130 to choose an SRS of 4 hotels. 01 Aloha Kai 08 Captiva 15 Palm Tree 22 Sea Shell 02 Anchor Down 09 Casa del Mar 16 Radisson 23 Silver Beach 03 Banana Bay 10 Coconuts 17 Ramada 24 Sunset Beach 04 Banyan Tree 11 Diplomat 18 Sandpiper 25 Tradewinds 05 Beach Castle 12 Holiday Inn 19 Sea Castle 26 Tropical Breeze 06 Best Western 13 Lime Tree 20 Sea Club 27 Tropical Shores 07 Cabana 14 Outrigger 21 Sea Grape 28 Veranda 69051 64817 87174 09517 84534 06489 87201 97245 69 05 16 48 17 87 17 40 95 17 84 53 40 64 89 87 20 Our SRS of 4 hotels for the editors to contact is: 05 Beach Castle, 16 Radisson, 17 Ramada, and 20 Sea Club.
EXAMPLE: Describe how you could obtain a simple random sample of all students enrolled in AP English classes at MHS. First, get a list of all AP English classes. Then go to each instructor and ask for a list of all students in their classes. Finally, combine all of the lists, delete any repeating names, and use a random digit table (generator) to select the sample.