Download
1 / 19
190 likes | 196 Views
Data Collection: Surveys & Sampling Methods. How do we gather data?. Surveys Opinion polls Interviews Studies Observational Retrospective (past) Experiments. Sampling Design: method used to choose the sample from the population Types of Samples: Simple Random Sample

E N D
How do we gather data? • Surveys • Opinion polls • Interviews • Studies • Observational • Retrospective (past) • Experiments
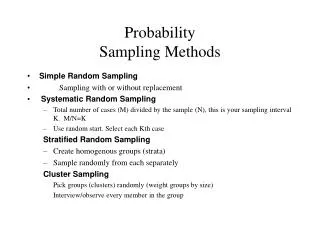
Sampling Design: method used to choose the sample from the population Types of Samples: Simple Random Sample Stratified Random Sample Systematic Random Sample Cluster Sample Multistage Sample Sampling Design
consist of n individuals from the population chosen in such a way that every individual has an equal chance of being selected every set of n individuals has an equal chance of being selected Simple Random Sample (SRS)
Population is divided into homogeneous (alike) groups called strata Strata 1: Seniors Strata 2: Juniors SRS’s are pulled from each strata Helps control for lurking variables Stratified Random Sample
Pick a method of identifying subjects randomly before starting Requires strict adherence Example: Suppose a supermarket wants to study buying habits of their customers, then using systematic sampling they can choose every 10th or 15th customer entering the supermarket and conduct the study on this sample. Systematic Random Sample
Based upon location Randomly pick a location & sample all there Examples: Houses on a certain block Houses in a specific zip code Students at specific schools in MDCPS Students in specific homeroom classes Cluster Sample
At least two separate levels/stages of SRS. Example: Stage 1: Juniors vs. Seniors Stage 2: Divide the above groups (Juniors and Seniors) by AP, Regular and Honors….select 10 for each of the groups for a total of 60. Multistage Sample
SRS • Advantages • Unbiased • Easy • Disadvantages • Large variance • May not be representative • Must have sampling frame (list of population)
Stratified • Advantages • More precise unbiased estimator than SRS • Less variability • Cost reduced if strata already exists • Disadvantages • Difficult to do if you must divide stratum • Formulas for SD & confidence intervals are more complicated
Cluster Samples • Advantages • Unbiased • Cost is reduced • Disadvantages • Clusters may not be representative of population • Formulas are complicated
Identify the Sampling Design 1)The Educational Testing Service (ETS) needed a sample of colleges. ETS first divided all colleges into groups of similar types (small public, small private, etc.) Then they randomly selected 3 colleges from each group.
Identify the Sampling Design 2) A county commissioner wants to survey people in her district to determine their opinions on a particular law up for adoption. She decides to randomly select blocks in her district and then survey all who live on those blocks.
Identify the Sampling Design 3) A local restaurant manager wants to survey customers about the service they receive. Each night the manager randomly chooses a number between 1 & 10. He then gives a survey to that customer, and to every 10th customer after them, to fill it out before they leave.
ERROR Favors certain outcomes Leads to BAD and unusable results Bias
Voluntary Response: People chose to respond. Usually only people with very strong opinions respond Non-response: Occurs when an individual chosen for the sample can’t be contacted or refuses to cooperate Convince Sampling/Undercoverage: Only ask people easy to ask. Ignores homeless, people without phones, etc. Response Bias: People tend to chose the popular, ethical answer. Question Wording: Bad questions can lead to bad data. People answer the question in a way they did not intend. Sources of Bias
Source of Bias? 1) Before the presidential election of 1936, FDR against Republican ALF Landon, the magazine Literary Digest predicting Landon winning the election in a 3-to-2 victory. A survey of 10 million people. George Gallup surveyed only 50,000 people and predicted that Roosevelt would win. The Digest’s survey came from magazine subscribers, car owners, telephone directories, etc.
2) Suppose that you want to estimate the total amount of money spent by students on textbooks each semester at FSU. You collect register receipts for students as they leave the bookstore during lunch one day.
3) To find the average value of a home in North Miami, one averages the price of homes that are listed for sale with a realtor.