Download
1 / 52
530 likes | 627 Views
Introduction to Surveys : Populations, Modes and Sampling Frames. PHC 6716 May 18, 2011 Chris McCarty. Census. Census - Data collection (or an attempt at data collection) from every member of a population Purpose – To know certain characteristics of a population

E N D
Introduction to Surveys: Populations, Modes and Sampling Frames PHC 6716 May 18, 2011 Chris McCarty
Census Census - Data collection (or an attempt at data collection) from every member of a population Purpose – To know certain characteristics of a population Example 1 – US census every ten years is a census of households Example 2 – A survey of all members of the Florida Association of Realtors
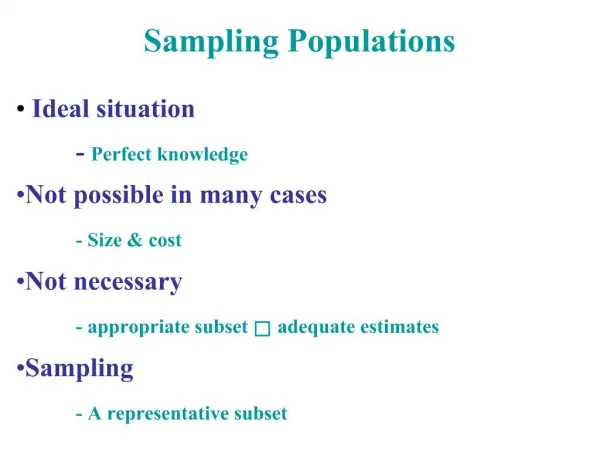
Why and when to do a census • The results of a census are a description of the population • There are no concerns over inference of the results • It is ideal when the size of the population is relatively small • A census is subject to non-sampling error • Systematically missing the homeless • Systematically missing highly mobile people
Survey • Data collection (or an attempt at data collection) from a sample of a population • Surveys are subject to sampling and non-sampling error • Sampling error – Failure to capture population characteristics due to chance
Reasons to do a survey • Scenario 1 – Sample designed to estimate the prevalence of something • Scenario 2 – Sample designed to test the relationship between variables (must represent the range of variables used to test relationships) • Scenario 3 – Both
Example 1 - Florida Health Insurance Survey Client - Florida Agency for Health Care Administration (AHCA) and U.S. Health Resources and Services Administration (HRSA) http://ahca.myflorida.com/Medicaid/quality_management/mrp/Projects/fhis2004/PDF/fhis_comparison_report_aug2005.pdf Sample designed to be representative of the population (or subgroups) for the purpose of estimating the prevalence of something FHIS was designed to estimate the rate of the uninsured for Florida, regions of Florida (17), Race and Ethnic subgroups in Florida, Income levels in Florida
Design Random Digit Dial Telephone survey All telephone exchanges in Florida were divided into a set of 85 strata defined by district, income race and ethnicity. Using census data overlaid to exchanges (GENESYS), initial targets were set After first wave of completes, targets were readjusted After second wave, targets were readjusted
Specifics 135,976 telephone numbers released 17,435 completed interviews (about 8.4 numbers released per complete) Approximately 14 minutes per interview Letter sent to all non-contacts in last months of survey Result – Percent of Floridians under age 65 who were uninsured in 2004 was 19.2% (up from 16.8% in 1999)
Example 2 – Oral Pain Survey Client – UF College of Medicine and National Institutes of Health Baseline survey with three-month follow-up Survey designed to capture respondents with particular oral pain symptoms and particular demographic characteristics Purpose: To understand relationship between demographic characteristics (race and ethnicity) and oral pain symptoms while controlling for intervening variables (income, sex, age)
Specifics 2,776 baseline completes out of 59,483 released RDD sample with disproportionate banks associated with Hispanic and African American households Quotas for cells combining race, ethnicity and income The follow-up had 1,006 completes out of 1,726 released. There was a $15 incentive for the baseline and a $15 incentive for the follow-up
Differences between approaches Surveys estimating the prevalence of something must either be representative or allow for weighting back to something that is representative Surveys designed to test relationships must have power (i.e. a full range of values) in variables to be tested
A few definitions • Population – The people your research says you are interested in studying • Survey Mode – The process used to collect data from the population • Sample Frame – A list that represents the population and allows you to draw a sample to use with your selected mode • Non-sampling error – Error associated with collecting the data • Sampling error – Error associated with pulling the sample
Defining the population • Research question suggests population • Geography • Demographic characteristics • Time frame • Examples: • Are Florida HMO members satisfied with their service? • Do Hispanic migrants get breast cancer screenings? • Does obesity in children lead to diabetes?
Survey Modes • Face-to-face • Mail • Telephone • Web
Face-to-face – How to do it • Typically cluster sampling (unless geography is small) • Use Census tracks and blocks as sample frame to select an area, then pick every nth household • Make a map of an area as sample frame then pick every nth household • Depending on population can also use lists as sample frame • Typically make at least three return visits at different times of the day and week • Can be done with paper and pencil or computer
Face-to-faceAdvantages and Disadvantages • Advantages • High response rates • Lower levels of satisficing (offering responses that satisfy interviewer but are not a true representation of fact or opinion) • Higher confidence in respondent selection • Use of show cards and other visual aids • Can usually do longer interviews • Disadvantages • Most expensive • May be less representative due to compromises in sampling strategy • Depending on population, may be dangerous to interviewers • Difficult to maintain interviewing staff
Face-to-face examples • Post election survey in Ghana (1997) • Survey of UF students regarding hookah use (2010)
Post election survey in Ghana • Question: Did Ghanaians think the 1996 elections were honest? • Sample frame – Polling stations using voter registration rather than Census • Ghana has 10 regions, and each received at least 220 of a total of 2300 interviews • Within each region we distributed a clusters of 10 interviews
Hookah Survey Background • Hookah use among college students is estimated to be between 10-11% • Universities often rely on Web surveys of students, often e-mailing all students listed by the Registrar • Students are therefore increasingly inundated with e-mails • In the past UF has warned students not to respond to unsolicited e-mail • We proposed a face-to-face survey of 1,000 students
Hookah survey method • Five locations on campus • Plaza of the Americas • Turlington Hall • West Campus Recreation Center • Communicore Building • Reitz Union • Rotated times of days and days of week at each site • Tables set up with laptops and a 10 minute CATI survey • Interviewer offered every 10th person to walk by a $5 gift card to complete
Hookah Survey Results • A total of 1,203 completed interviews • Race and sex were weighted, but were not far off Registrar characteristics • 10.9% (131) reported current hookah use, approaching the current cigarette use rate of 11.7% • More students have tried hookah (45.4%) than cigarettes (40.3%) or any other form of tobacco
Mail – How to do it • Always use lists as sample frames • Usually have return envelope with stamp or meter where you pay if sent • Can do drop-off (has face-to-face limitations) • Typically do multiple mailings or post card reminders • Often include token incentives in envelope • Returned surveys are sometimes double entered • Can save on costs by outsourcing printing and mailing • Can be personalized with signatures • FedX, Priority Mail and First Class more noticeable • May want to hide respondent identifier inside envelope • Can do scannable forms
Mail: Advantages and Disadvantages • Advantages • Can be less expensive • May be better for certain sensitive questions • Can include show cards or other visual aids • Sometimes is the only choice given available sample frames • Disadvantages • Often lower response rates than face-to-face and phone • Takes longer to finish survey process • Little control over respondent selection • Respondents often leave information missing or write in their own response categories (effectively missing) • Limitations with skip logic and use of previous answers in latter part of questionnaire • P.O boxes often not included in sample when overlaying geography
Mail - Examples • Water Management District
Water Management Survey • Purpose: Measure household characteristics and perceptions of water use • Mail out of 7,200 surveys based on utility bill data (address only accurate contact) • 450 for each of 16 participating water utilities • Double data entry
Water Management Survey • Three stages: • Advance Letter one week before survey. Included 1-800 number for questions • Survey package • $1 incentive for about 1,500 lower income respondents • Self addressed envelope metered to charge upon receipt • Packets in Miami-Dade received packet in English and Spanish • Thank you/Reminder postcard
Telephone – How to do it • Listed Sample • Listed sample often comes from phone directory • Advantage is less dialing • Disadvantage is biased phone coverage (nationally unlisted numbers may be as much as 30%, and 50% in some urban areas) • Lists from member files or other databases (This is most of what we do) • Random Digit Dial (RDD) • Telephone numbers made up using information on released banks (a bank is defined by Area code + Prefix + first two digits of suffix) • Not all banks are released • They tend to cluster (Waxberg sample) • Can have phone numbers purged of businesses and charities • Zero, 1-plus, 2-plus banks
Telephone – How to do it (continued) • Predictive dialer – A file server that dials calls and diverts interview to person when answer detected (responsible for pause) • Sample management software • Wincati • Blaise • mrInterview CATI (SPSS) • Survey analysis software (SUDAAN from RTI)
Telephone: Advantages and Disadvantages • Advantages • High response rate • Fast • Allows for complex skip logic and use of previous answers in latter part of survey • Relatively high coverage (about 95% nationally have phones) • More control over respondent selection • Complex sample management • Immediate data entry • Disadvantages • Falling response rates (telemarketing, caller ID, cell phones) • No show cards or visual aids • With some populations there is no viable frame
Do Not Call Lists • National Do Not Call List (www.donotcall.gov) • Some states (http://www.the-dma.org/government/donotcalllists.shtml) • Surveys and charities are exempt • Respondent usually does not know that
Telephone - Examples • Monthly consumer confidence survey • HMO Report Card
Monthly CCI Survey • Purpose: Predict Florida consumer spending using index • Field time constrained to one month • Used to be one sample of 5,000 RDD numbers in a month and 500 completed interviews • Changed to two, two-week surveys with 2,600 RDD numbers released and 250 completes • Numbers are released proportionate to households by county with post-weighting for disproportionate coverage
HMO Report Card • Purpose: Measure and publish customer satisfaction using CAHPS for each Medicaid HMO in Florida • Listed sample pulled from AHCA database for customers who have been in plan for at least 6 months • Attempt 300 completed interviews from each plan for Adults and for Children • Set of indicators published on AHCA web site: http://www.floridahealthfinder.gov/HealthPlans/Compare.aspx
Web – How To Do It • Many online vendors, but they often only provide questionnaire authoring and storage, little sample management (e.g. Survey Monkey) • Costs are (in my opinion) inflated • Ideal for certain populations
Web: Advantages and Disadvantages • Advantages • Typically inexpensive (at least it should be) • Data are automatically entered and edited upon entry • Maximum versatility in the use of visual aids and audio • Less satisficing for some sensitive questions • Disadvantages • Very low response rates • Incomplete and biased coverage for household surveys (only about 75% of households versus 95% for phones) • No RDD version for e-mails, lack of comprehensive lists • May be combined with phone or mail to be effective
Web Example – Web of Science • Objective – Determine if co-authorship on the Web of Science is a method for the transmission of scientific innovation • Method – Conduct survey with representative sample of authors on the Web of Science
Procedure • We began by downloading all unique author/affiliation combinations from the Web of Science for 2006 – a total of 3,004,946 unique records (one scientist for every 2,181 people in the world) • We removed all records where the affiliation contained the strings univ, sch, or coll. This left 1,084,833 records • These records were randomized and the first 20,000 were exported and an attempt was made to find an e-mail for each record • We found 7,962 which were loaded into a web survey
Estimate of proportion working in non-academic setting • Of the 7,962 e-mail addresses sent out we received 747 (9.4%) completed surveys and indicated they had published an article • We estimate that 683,444 authors, or 23%, do not work at a college or university • Of those respondents working in a non-academic setting, nearly 72% consider themselves an academic
Common sources of lists • Telephone numbers and households listed in telephone directory • Can pull national sample • Unlisted numbers vary a lot by geographic area and respondent characteristics • Drivers licenses from state Department of Motor Vehicles • Must select samples by state, and states vary in laws regarding drivers licenses • Data may be old as people move without informing Department of Motor Vehicles • Nor every one drives and there are biases (old and young, people in urban settings with public transportation and high insurance costs)
Common sources of lists (continued) • Voter Registration • Potentially more updated than driver’s license database • Not everyone votes – potentially very biased unless survey concerns potential voters • Lists from behavioral surveys and credit card evaluation • Usually expensive • Can often select people with particular characteristics (e.g. smokers) • Potentially biased based on source • Member and User Lists such as patient records, HMO membership, recipients of Temporary Assistance for Needy Families (TANF) • Source is often variable in maintaining records (e.g. HMOs do not have common database practices for recording membership data)
Companies that supply sample • Marketing Systems Group – GENESYS • Survey Sampling • Affordable Sampling
Telephone survey sample options and costs • RDD with no filtering – $.04/record ($300 minimum) • RDD with business purging from yellow pages – $.05/record • RDD with business purge and attended dialing using automated detection – $.09/record • Experian Behavior Bank – $.35/record