Download
1 / 39
390 likes | 430 Views
Climate implications for Agricultural Production within the Murray Valley of NSW. Michael Cashen – Climatologist, Agriculture michael.cashen@industry.nsw.gov.au John Smith – District Agronomist, Barham john.smith@industry.nsw.gov.au. So what’s the talk about?. The three P’s

E N D
Climate implications for Agricultural Production within the Murray Valley of NSW Michael Cashen – Climatologist, Agriculture michael.cashen@industry.nsw.gov.au John Smith – District Agronomist, Barham john.smith@industry.nsw.gov.au
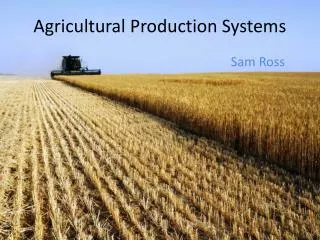
So what’s the talk about? • The three P’s • Climate indicators Deniliquin and MDB • Relevant research quantifying uncertainty • Impacts on farming systems • Future implications for farm businesses and Deniliquin
The three P’s of climate change Policy Peripheral Physical
Policy responses- Climate Change • Emission Trading Scheme (ETS), Carbon Pollution Reduction Scheme (CPRS) and Carbon Tax. • Water policy review (MDBA- draft basin plan) • Exceptional circumstance policy review
Peripheral responses-Climate Change Niche marketing and preferential buying • Food miles • Carbon footprint (life cycle analysis) • Carbon neutral Our focus today- Physical (science and biophysical impacts on Ag)
So what’s the talk about? • The three P’s • Climate indicators Deniliquin and MDB • Relevant research quantifying uncertainty • Impacts on farming systems • Future implications for farm businesses and Deniliquin
Rainfall in Deniliquin (1889-2009) Iconic droughts 1900-1909, 1936-45 and 1997-2009 Data source: SILO Data Drill
Seasonal analysis rainfall (1889-2009) Data source: SILO Data Drill
Autumn rainfall-Deniliquin Data source: SILO Data Drill
Murray Darling Basin- annual rainfall Iconic droughts 1900-1909, 1936-45 and 1997-2009
MDB- Winter and Spring rainfall Data source: BoM Drivers of winter/spring variability ENSO/IOD Ummenhofer et al 2010
Autumn rainfall-Deniliquin Data source: SILO Data Drill
Impact on Deniliquin 83% Source: S Gannon Westpac 2010
So what’s the talk about? • The three P’s • Climate indicators Deniliquin and MDB • Relevant research quantifying uncertainty • Impacts on farming systems • Future implications for farm businesses and Deniliquin
So what’s the talk about? • The three P’s • Climate indicators Deniliquin and MDB • Relevant research quantifying uncertainty • Impacts on farming systems • Future implications for farm businesses and Deniliquin
Reduced PAW in winter crop growing seasonStored soil moisture 61-90 = 69.2mmStored soil moisture 91-08 = 40.7mm (-28.5mm)
Implications for reduced water • Changes in water priorities • Less water available when decisions need to be made • Winter crops for yield potential • Calculated risk on water availability for rice
Implications for industry – rice (Gaydon et al., 2010) • Declines in irrigation water supply -ve impact • Potential increases in water demand (?) - increased ET but quicker growth • Low-temperature damage may be reduced (?) • Significant improvements in water productivity difficult under existing systems – less water = less rice
Rice farming system changes • Adaptation • Drill sowing - Farm layouts • Aerobic rice - New Varieties • AWD - Irrigation methods
Implications for industry – grains (Howden et al., 2010) • Enhanced growth with elevated CO2 • Increased photosynthetic rates and WUE • Reduced frost risk • Accelerated plant development with increased temp. • Reduced yield without variety adaptation • More rapid depletion of soil moisture • Rainfall is a key determinant of yield – considerable risk of lower rainfall = lower yield
Implications for industry – grains (Howden et al., 2010) • Pests and disease - variable but for us • Stripe rust • increase with milder winter temps, quicker life cycle • Viral Diseases (Barley Yellow Dwarf) • increase with warmer winter temps, more aphid activity • Take all • decrease, favoured by wet soil conditions
Take home message • Temps are up • Autumn rainfall down • STR intensification driving autumn decline (temp) • GCM uncertainty around autumn (under estimate?) • Impacting on water availability • Less water less production
So what’s the talk about? • The three P’s • Climate indicators Deniliquin and MDB • Relevant research quantifying uncertainty • Impacts on farming systems • Future implications for farm businesses and Deniliquin
Future implications for farms • Scale (Diversification) • Return on water and land asset base (Review) • Equity level (Key to survival) • Flexible systems (annual –turn on or off)
References Gaydon DS, Beecher HG, Reinke R, Crimp S and Howden SM (2010) ‘Rice’. In Adapting Agriculture to Climate Change. CSIRO Publishing Howden SM, Gifford RG and Meinke H (2010) ‘Grains’. In Adapting Agriculture to Climate Change. CSIRO Publishing Timbal B (2010) ‘Understanding the anthropogenic nature of observed rainfall decline across south-eastern Australia. Centre for Australian Weather and Climate Research, Technical Report No. 026 Ummenhofer CC, Alexander SG, Briggs PR, England MH, McIntosh PC, Meyers GA, Pook MJ, Raupach MR, Risbey JS (2010). Indian and Pacific Ocean Influences on Southeast Australian Drought and Soil Moisture. Journal of Climate. Published on line in (http://journals.ametsoc.org) DOI 10.1175/2010JCLI3475.1
El Nino Southern Oscillation Image source: Bureau of Meteorology
Indian Ocean Dipole Image source: www.oceansatlas.org
The years of ENSO/IOD (Ummenhofer et al 2010)
Impact of ENSO/IOD events MDB Figures inside brackets indicated number of events (1900-2006) Note: variation in impact between case study sites
http://www.climatechangeinaustralia.gov.au/technical_report.phphttp://www.climatechangeinaustralia.gov.au/technical_report.php