Download
1 / 42
420 likes | 426 Views
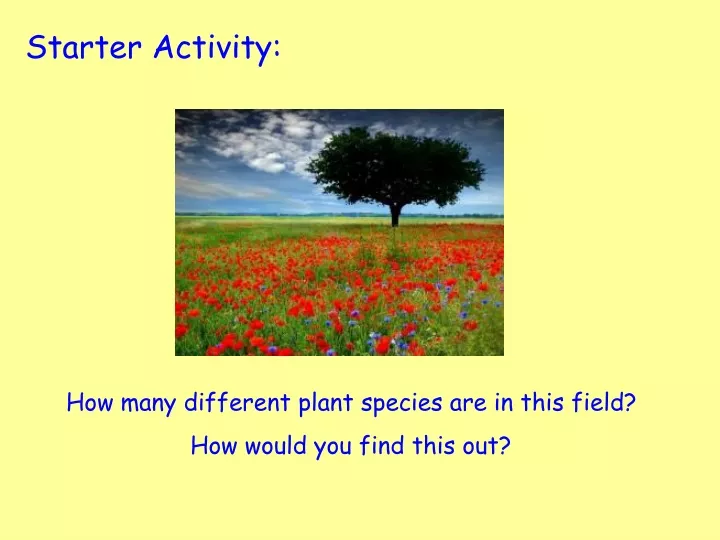
Starter Activity:. How many different plant species are in this field? How would you find this out?. Appropriate Clip art to topic. Sampling Techniques. Learning Intention: Using quantitative techniques to sample plants and animals. Success Criteria:

E N D
Starter Activity: How many different plant species are in this field? How would you find this out?
Appropriate Clip art to topic Sampling Techniques Learning Intention: Using quantitative techniques to sample plants and animals. Success Criteria: Describe ways to measure abundance of organisms in an ecosystem. Identify errors in sampling techniques and suggest how errors can be minimised.
Sampling Techniques • Studying an ecosystem involves: • Finding out what plants and animals live there. • Finding out how many of them live there. • Finding out why they live there. Think: How would you do this? Pair: Discuss with a partner how would carry out each of the above Share: With another pair discuss your ideas.
Abundance • Abundance is the measure of how frequently a species of plant or animal appears in particular area. • Abundance can be measured using sampling techniques.
Counting plants • It would be very difficult to count every single plant in a field. How could you resolve this problem? • We can sample using a quadrat.
Sampling using a quadrat: • A quadrat is a square frame with a known area such as 1m2 • It is used to estimate numbers of plants or slow moving animals (slugs or snails). 1m 1m
Example 1 Estimating the abundance of thistles in a field: • Quadrat placed at random and number of thistles in quadrat counted. • Repeated several times. • Average number per square metre is calculated. • Area of whole field measured • Estimate of total number of thistles in field calculated
Example 2 Calculate the abundance of flowers in a field with a total area of 150m2 _______flowers in 1m2. _______ x ________= ____ flowers in a field of 150m2. 12 12 150 1800 1m 1m
In reality, to make the results of abundance more reliable, many samples would be taken using quadrats and the results then averaged before calculating the abundance of the entire area. So for the 150m2 area, Abundance = 11 x 150 = 1650 flowers
Possible sources of error with quadrats Match up correct method of minimising error to the source of error: Sources of Error Method of minimising errors • Use the same rule for each quadrat to • count part of organisms or not. 1. Organisms in the quadrat may be wrongly identified. B. Use a key to make sure that the organisms are correctly identified. 2. Organisms in the quadrat may be wrongly counted. 3. Too few samples have been taken to be representative of the habitat. C. If you notice that organisms are in clusters, increase the sample size. 1. Pair the numbers and letters on a show me board. 2. Create a table in your notebook to show a summary of these errors.
Sampling Using a Pitfall Trap • A container is placed in a hole in ground to trap animals that are active at the soil surface. • Several traps should be set up to increase reliability of the results.
Pitfall Trap • Traps can be placed to compare different areas and see what animals are more abundant in each.
Possible sources of error in Pitfall traps Match up correct method of minimising error to the source of error: Sources of Error Method of minimising errors A. Camouflage the opening of the trap 1. Type of animals trapped may not be representative of the area B. Set up more pitfall traps 2. Birds eat trapped animals 3. Within trap, some animals eat other animals C. Punch holes in the base of the trap D. Check traps regularly, removing animals 4. Rainwater collects in trap killing animals 1. Pair the numbers and letters on a show me board. 2. Create a table in your notebook to show a summary of these errors.
Other Methods of Sampling Your task… Use page 284 – 285 of the National 5 text book to make notes about further sampling techniques, adding possible sources of error and how you would overcome these. You may present the information any way you wish. • Tullgren funnel • Pooters • Tree beating • Sweep netting • Pond netting
Appropriate Clip art to topic Sampling Techniques Learning Intention: Using quantitative techniques to sample plants and animals. Success Criteria: I can describe ways to measure abundance of organisms in an ecosystem. I can identify errors in sampling techniques and suggest how errors can be minimised.
How would you explain to a small child how to identify the following organisms? Starter Activity: Ideas on a show me board
Appropriate Clip art to topic Classification Keys Learning Intention: Paired statement keys. Success Criteria: I can construct paired statement keys to identify unknown plants or animals found during sampling an ecosystem.
Classification Keys • When using sampling methods, it is important that you are able to identify the plants or animals you have found. • One method of identification is to use a key.
Keys • Used to identify organisms while sampling. • There are two types • Branched keys • Paired Statement keys
Branching keys • A key is a series of questions. Each question leads to another until eventually the name of the organism is found.
Paired Statement Key • Instead of asking questions at branching points on a diagram, you are asked to choose between two statements. • Each pair of statements is numbered and the instructions send you to the next relevant pair of statements.
Vertebrates Remember to use obvious visible characteristics when constructing paired statement keys. What are the obvious visible characteristics?
Invertebrates Remember to use obvious visible characteristics when constructing paired statement keys. wasp centipede earwig spider What are the obvious visible characteristics?
Invertebrates Remember to use obvious visible characteristics when constructing paired statement keys. Caddis fly larva mayfly Fresh water shrimp What are the obvious visible characteristics? limpet flatworm stonefly
Paired Statement Key 1. 5. 2. 4. 6. 3. Click on a leaf number 1 to start, then complete leaves 2-6 in that order
Example 1 Construct a paired statement key for the information below:
Example 2 Construct a paired statement key for the information below:
Example 3 Construct a paired statement key for the information below:
Example 4 Construct a paired statement key for the information below:
Appropriate Clip art to topic Classification Keys Learning Intention: Paired statement keys. Success Criteria: I can construct paired statement keys to identify unknown plants or animals found during sampling an ecosystem.
Starter Activity: How would you sample this field?
Appropriate Clip art to topic Sampling Techniques Learning Intention: Using quantitative techniques to sample plants and animals. Success Criteria: Measure abundance of organisms in an ecosystem. I can identify errors in sampling techniques and suggest how errors can be minimised.
Appropriate Clip art to topic Sampling Techniques Your task… measure the abundance of grass species in the school grounds. Think: What equipment will you need to do this? Pair: Discuss the size of area are you going to sample and where this area will be. How will you record your results? Share: Explain how you will measure the abundance of grass species in the school grounds.
Appropriate Clip art to topic Sampling Techniques • Method: • Mark out your area e.g. 5m x 5m • Decide how you will take random samples. e.g. using coordinates from a random numbers table. • Decide how you will record your data using the quadrat, to ensure you are consistent each time and a valid sample. • Record the name of each species you find in each quadrat and the NUMBER of each species (% coverage) • Repeat this for 10 quadrat samples Equipment List: Classification key – common grasses Quadrat Tape measure Results table Clipboard
How to sample abundance with a quadrat: You are going to use a 25m²quadrat to investigate the % coverage of plant species. The easiest way to calculate % coverage is to imagine each box split into 4, so each quarter is worth 1% (or each square is worth 4%) and count how many sections of squares that particular plant species is covering. E.g. Look at the yellow dandelion flowers, how many sections does it cover? Answer: 1 quarter of a square = 1% In this picture the dandelion flowers cover 1 quarter of a square = 1% 1 quarter of a square = 1% 1 square = 4%
Appropriate Clip art to topic Sampling Analysis Use your data and knowledge about quadrat sampling to answer the following in FULL sentences: How many different plant species did you identify? Which plant species was most abundant? Which plant species was least abundant? What sources of error could have affected your results? How did you overcome these sources of error?
Appropriate Clip art to topic Sampling Techniques Learning Intention: Using quantitative techniques to sample plants and animals. Success Criteria: Measure abundance of organisms in an ecosystem. I can identify errors in sampling techniques and suggest how errors can be minimised.
Wet weather alternative for quadrat sampling: Click this link for the online resource