Download
1 / 15
150 likes | 248 Views
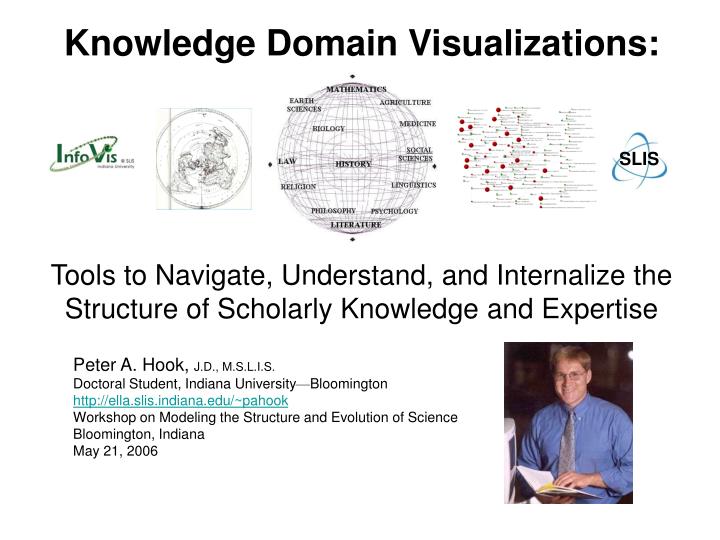
Knowledge Domain Visualizations:. SLIS. Tools to Navigate, Understand, and Internalize the Structure of Scholarly Knowledge and Expertise. Peter A. Hook, J.D., M.S.L.I.S. Doctoral Student, Indiana University — Bloomington http://ella.slis.indiana.edu/~pahook

E N D
Knowledge Domain Visualizations: SLIS Tools to Navigate, Understand, and Internalize the Structure of Scholarly Knowledge and Expertise Peter A. Hook, J.D., M.S.L.I.S. Doctoral Student, Indiana University—Bloomington http://ella.slis.indiana.edu/~pahook Workshop on Modeling the Structure and Evolution of Science Bloomington, Indiana May 21, 2006
Distance—Similarity Metaphor 1654 Madeleine de Scudéry (b. 1607-d. 1701), Clélie, histoire romaine, première partie (Clélie: A Roman Story, part I), Paris, 1654, Reserve of Rare and Precious Books, Rés. Yý. 1496 “Carte du tendre (Map of Affection), engraved by François Chauveau and inserted in the first part of the novel. A salon game, the Map sparked a fad for "amorous geography" that took the form of allegorical almanacs and imaginary maps.” From: Creating French Culture: Treasures from the Bibliotheque Nationale de France, Library of Congress, Available at:http://www.loc.gov/exhibits/bnf/bnf0004.html
Descriptive Scientific Cartography Prior to the 1600’s cartography was merely descriptive. Advances in calculating location on the planet made it scientific. • Triangulation over large distances from a known base measure. • Using the moons of Jupiter to establish longitude on land. • Using accurate time pieces to establish longitude at sea. • Accurately measuring depth and altitude, and representing them on maps. The same has now occurred with domain mapping. • The descriptive has become methodologically rigorous. Headrick, Daniel R. (2000). When Information Came of Age: Technologies of Knowledge in the Age of Reason and Revolution, 1700-1850. New York: Oxford University Press.
1696 • First Accurate Map of the Earth • 40 points of accurate longitude • Based on Moons of Jupiter to compare with local time in Paris. • Cassini. Morrison, Philip and Phylis (1987). The Ring of Truth. New York: Random House.
1939 John D. Bernal was a world renowned physicist, a historian of science, and a sociologist of science. He is considered to have produced one of the first ‘maps’ of science. Bernal, J.D. (1939). The Social Function of Science. London: Routledge & Kegan Ltd.
1948 Ellingham, H. J. T. (1948), Divisions of Natural Science and Technology, in Reports and Papers of the Royal Society Scientific Information Conference, 21 June – 2 July, 1948. London: The Royal Society, Burlington House.
1973 Co – Discoveries / Implementation Using Co-Citation to create domain maps. • Small, H. (1973). Co-citation in the scientific literature: A new measure of the relationship between two documents. JASIS, 24, 265-269. • Marshakova, I.V. (1973). A system of document connections based on references. Scientific and Technical Information Serial of VINITI, 6, 3-8.
Concept Maps Used in the Field of Education Feather, Ralph M. Jr., Snyder, Susan Leach & Hesser, Dale T. (1993). Concept Mapping, workbook to accompany, Merrill Earth Science. Lake Forest, Illinois: Glencoe. Benefits of Computer-Based Collaborative Learning Environments Kealy, William A. (2001). Knowledge Maps and Their Use in Computer-Based Collaborative Learning Environments. Journal of Educational Computing Research. 25(4) 325-349.
2004 Supreme Court Term West Topic Space(Procedural Topics Removed)
Visualizing the Harvard Law Review Supreme Court Statistics July 2, 2005 New York Times
Ideological Landscape of the Justices (1994 – 2003) Appointed by a Democrat Appointed by a Republican Voting frequencies represented as the edge weight between nodes and presented visually as a graph. (Rendered with Pajek using a stochastic, spring force algorithm.)
Thresholding (Voting Together > 49%) Reveals Ideological Cliques
By spatially navigating bibliographic data, is the underlying structural organization of the domain conveyed to the user? • Does this lead to better problem solving in the domain? • C. Is the user able to infer something about an unknown topic based on its proximity to topics with which he/she is already familiar?
THE END Places & Spaces