Download
1 / 1
10 likes | 81 Views
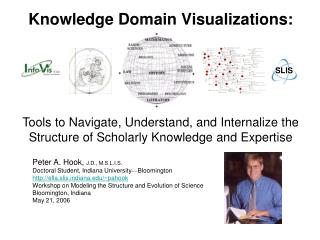
Hook, Peter A. and Börner, Katy. (in press) Educational Knowledge Domain Visualizations: Tools to Navigate, Understand, and Internalize the Structure of Scholarly Knowledge and Expertise. In Amanda Spink and Charles Cole (eds.) New Directions in Cognitive Information Retrieval. Springer-Verlag.

E N D
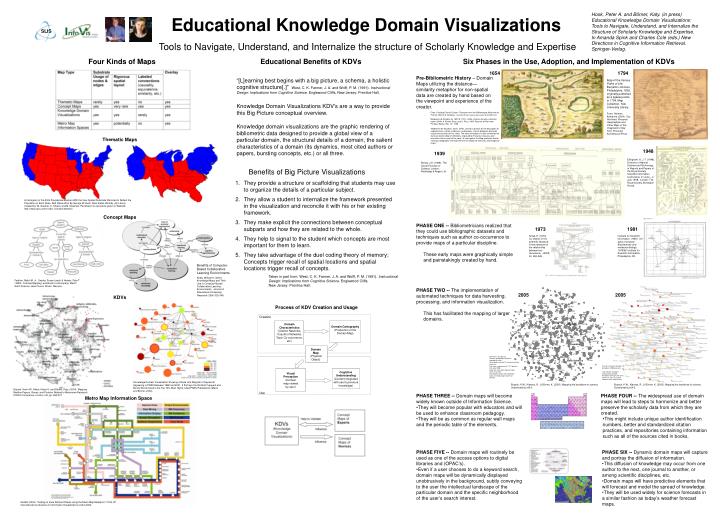
Hook, Peter A. and Börner, Katy. (in press) Educational Knowledge Domain Visualizations: Tools to Navigate, Understand, and Internalize the Structure of Scholarly Knowledge and Expertise. In Amanda Spink and Charles Cole (eds.) New Directions in Cognitive Information Retrieval. Springer-Verlag. Educational Knowledge Domain Visualizations Tools to Navigate, Understand, and Internalize the structure of Scholarly Knowledge and Expertise SLIS Four Kinds of Maps Educational Benefits of KDVs Six Phases in the Use, Adoption, and Implementation of KDVs 1654 1794 Pre-Bibliometric History – Domain Maps utilizing the distance—similarity metaphor for non-spatial data are created by hand based on the viewpoint and experience of the creator. “[L]earning best begins with a big picture, a schema, a holistic cognitive structure[.]” West, C. K. Farmer, J. A. and Wolff, P. M. (1991). Instructional Design: Implications from Cognitive Science. Englewood Cliffs, New Jersey: Prentice Hall. Map of the Various Paths of Life, Benjamin Johnson, Philadelphia, 1805, originally published as a jigsaw puzzle in 1794, Map Collection, Yale University Library. Knowledge Domain Visualizations KDV’s are a way to provide this Big Picture conceptual overview. From: Creating French Culture: Treasures from the Bibliotheque Nationale de France, Library of Congress, Available at:http://www.loc.gov/exhibits/bnf/bnf0004.html Madeleine de Scudéry (b. 1607-d. 1701), Clélie, histoire romaine, première partie (Clélie: A Roman Story, part I), Paris, 1654, Reserve of Rare and Precious Books, Rés. Yý. 1496 “Madeleine de Scudéry's novel, Clélie, served as pretext for the description of acquaintances, stately residences, and palaces, and for dialogues based on actual conversations of her salon. The most immediate stir was created by the Carte du tendre (Map of Affection), engraved by François Chauveau and inserted in the first part of the novel. A salon game, the Map sparked a fad for "amorous geography" that took the form of allegorical almanacs and imaginary maps.” From: Harmon, Katherine (2004). You Are Here: Personal Geographies and Other Maps of the Imagination. New York: Princeton Architectural Press. Knowledge domain visualizations are the graphic rendering of bibliometric data designed to provide a global view of a particular domain, the structural details of a domain, the salient characteristics of a domain (its dynamics, most cited authors or papers, bursting concepts, etc.) or all three. Thematic Maps 1948 1939 Ellingham, H. J. T. (1948), Divisions of Natural Science and Technology, in Reports and Papers of the Royal Society Scientific Information Conference, 21 June – 2 July, 1948. London: The Royal Society, Burlington House. Bernal, J.D. (1939). The Social Function of Science. London: Routledge & Kegan Ltd. Benefits of Big Picture Visualizations • They provide a structure or scaffolding that students may use to organize the details of a particular subject. • They allow a student to internalize the framework presented in the visualization and reconcile it with his or her existing framework. • They make explicit the connections between conceptual subparts and how they are related to the whole. • They help to signal to the student which concepts are most important for them to learn. • They take advantage of the duel coding theory of memory; Concepts trigger recall of spatial locations and spatial locations trigger recall of concepts. • Taken in part from, West, C. K. Farmer, J. A. and Wolff, P. M. (1991). Instructional Design: Implications from Cognitive Science. Englewood Cliffs, • New Jersey: Prentice Hall. A Cartogram of the 2004 Presidential Election With the Geo-Spatial Substrate Distorted to Reflect the Population of Each State. Red States Won By George W. Bush. Blue States Won By John Kerry. Created by: M. Gastner, C. Shalizi, and M. Newman. Permission to reproduce given on Website: http://www.cscs.umich.edu/~crshalizi/election/. Concept Maps • PHASE ONE -- Bibliometricians realized that they could use bibliographic datasets and techniques such as author co-occurrence to provide maps of a particular discipline. • These early maps were graphically simple and painstakingly created by hand. 1973 1981 Small, H. (1973). Co-citation in the scientific literature: A new measure of the relationship between two documents. JASIS, 24, 265-269. Institute for Scientific Information. (1981). ISI atlas of science: Biochemistry and molecular biology, 1978/80, Institute for Scientific Information, Philadelphia, PA. Benefits of Computer-Based Collaborative Learning Environments Kealy, William A. (2001). Knowledge Maps and Their Use in Computer-Based Collaborative Learning Environments. Journal of Educational Computing Research. 25(4) 325-349. Feather, Ralph M. Jr., Snyder, Susan Leach & Hesser, Dale T. (1993). Concept Mapping, workbook to accompany, Merrill Earth Science. Lake Forest, Illinois: Glencoe. • PHASE TWO -- The implementation of automated techniques for data harvesting, processing, and information visualization. • This has facilitated the mapping of larger domains. 2005 2005 KDVs Process of KDV Creation and Usage Creation Domain Characteristics (Citation Networks, Coauthor Networks, Topic Co-occurrence, etc.) Domain Cartography (Production of the Domain Map) Domain Map (Physical Object) Each dot is one journal. Journals grouped by discipline. Labeled by hand. Generated using the IC-Jaccard similarity measure. The map is comprised of 7,121 journals from year 2000. Large font size labels identify major areas of science. Small labels denote the disciplinary topics of nearby large clusters of journals. Clusters of journals denote 212 disciplines (7000 journals). Lines denote strongest relationships between disciplines (citing cluster gives more than 7.5% of its total citations to the cited cluster). Cognitive Understanding (Content integrated with user’s previous knowledge) Visual Perception (Domain map viewed by user) Knowledge Domain Visualization Showing a Node Link Diagram of Keywords Appearing in PNAS Between 1982 and 2001. It Portrays the 50 Most Frequent and Bursty Words Used in the Top 10% Most Highly Cited PNAS Publications (Mane and Börner, 2004). Boyack, K.W., Klavans, R., & Börner, K. (2005). Mapping the backbone of science. Scientometrics 64:3. Boyack, K.W., Klavans, R., & Börner, K. (2005). Mapping the backbone of science. Scientometrics 64:3. Boyack, Kevin W., Mane, Ketan K. and Börner, Katy. (2004). Mapping Medline Papers, Genes, and Proteins Related to Melanoma Research. IV2004 Conference, London, UK, pp. 965-971 Use • PHASE FOUR -- The widespread use of domain maps will lead to steps to harmonize and better preserve the scholarly data from which they are created. • This might include unique author identification numbers, better and standardized citation practices, and repositories containing information such as all of the sources cited in books. • PHASE THREE -- Domain maps will become widely known outside of Information Science. • They will become popular with educators and will be used to enhance classroom pedagogy. • They will be as common as regular wall maps and the periodic table of the elements. Metro Map Information Space • PHASE FIVE -- Domain maps will routinely be used as one of the access options to digital libraries and (OPAC’s). • Even if a user chooses to do a keyword search, domain maps will be dynamically displayed unobtrusively in the background, subtly conveying to the user the intellectual landscape of the particular domain and the specific neighborhood of the user’s search interest. • PHASE SIX -- Dynamic domain maps will capture and portray the diffusion of information. • This diffusion of knowledge may occur from one author to the next, one journal to another, or among scientific disciplines, etc. • Domain maps will have predictive elements that will forecast and model the spread of knowledge. • They will be used widely for science forecasts in a similar fashion as today’s weather forecast maps. Nesbitt (2004). “Getting to more Abstract Places using the Metro Map Metaphor,” IV’04, 8th International Conference on Information Visualisation London,2004.