Download
1 / 36
360 likes | 471 Views
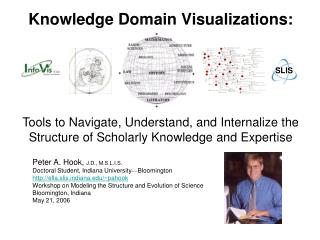
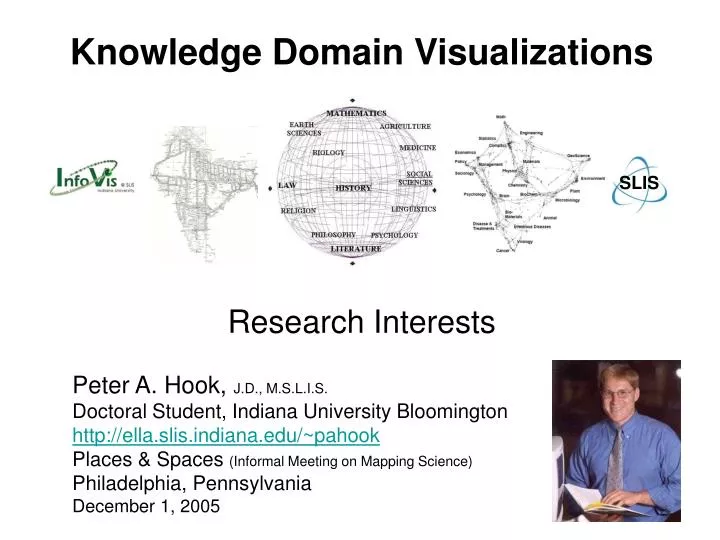
Knowledge Domain Visualizations. SLIS. Research Interests. Peter A. Hook, J.D., M.S.L.I.S. Doctoral Student, Indiana University Bloomington http://ella.slis.indiana.edu/~pahook Places & Spaces (Informal Meeting on Mapping Science) Philadelphia, Pennsylvania December 1, 2005.

E N D
Knowledge Domain Visualizations SLIS Research Interests Peter A. Hook, J.D., M.S.L.I.S. Doctoral Student, Indiana University Bloomington http://ella.slis.indiana.edu/~pahook Places & Spaces (Informal Meeting on Mapping Science) Philadelphia, Pennsylvania December 1, 2005
Research Interests • Cognitive Justification for Domain Maps • Pedagological Use of Domain Maps • User Testing of Domain Maps • History of Domain Maps • Mapping Legal Topics
Descriptive Scientific Cartography Prior to the 1600’s cartography was predominately descriptive. Advances in calculating location on the planet made it scientific. • Triangulation over large distances from a known base measure. • Using the moons of Jupiter to establish longitude on land. • Using accurate time pieces to establish longitude at sea. • Accurately measuring depth and altitude, and representing them on maps. The same is now occurring with domain maps. • We had descriptive maps for a long time. • Now they have become methodologically rigorous and scientific. Headrick, Daniel R. (2000). When Information Came of Age: Technologies of Knowledge in the Age of Reason and Revolution, 1700-1850. New York: Oxford University Press.
1870 • The mapping of India by triangulation. • Captain George Everest Morrison, Philip and Phylis (1987). The Ring of Truth. New York: Random House.
1696 • First Accurate Map of the Earth • 40 points of accurate longitude • Based on Moons of Jupiter to compare with local time in Paris. • Cassini. Morrison, Philip and Phylis (1987). The Ring of Truth. New York: Random House.
Pre-Bibliometric History Domain Maps utilizing the distance—similarity metaphor for non-spatial data are created by hand based on the viewpoint and experience of the creator.
1654 From: Creating French Culture: Treasures from the Bibliotheque Nationale de France, Library of Congress, Available at:http://www.loc.gov/exhibits/bnf/bnf0004.html Madeleine de Scudéry (b. 1607-d. 1701), Clélie, histoire romaine, première partie (Clélie: A Roman Story, part I), Paris, 1654, Reserve of Rare and Precious Books, Rés. Yý. 1496 “Madeleine de Scudéry's novel, Clélie, served as pretext for the description of acquaintances, stately residences, and palaces, and for dialogues based on actual conversations of her salon. The most immediate stir was created by the Carte du tendre (Map of Affection), engraved by François Chauveau and inserted in the first part of the novel. A salon game, the Map sparked a fad for "amorous geography" that took the form of allegorical almanacs and imaginary maps.”
1794 Map of the Various Paths of Life, Benjamin Johnson, Philadelphia, 1805, originally published as a jigsaw puzzle in 1794, Map Collection, Yale University Library. From: Harmon, Katherine (2004). You Are Here: Personal Geographies and Other Maps of the Imagination. New York: Princeton Architectural Press.
1939 John D. Bernal was a world renowned physicist, a historian of science, and a sociologist of science. He is considered to have produced one of the first ‘maps’ of science. Bernal, J.D. (1939). The Social Function of Science. London: Routledge & Kegan Ltd.
1948 Ellingham, H. J. T. (1948), Divisions of Natural Science and Technology, in Reports and Papers of the Royal Society Scientific Information Conference, 21 June – 2 July, 1948. London: The Royal Society, Burlington House.
1988 Shwerwood, M. & Sutton, C. (Eds). (1988). The Physical World. New York: Oxford University Press.
1895 1st Otlet and then De Solla Price Contemplate Domain Maps 1895 – Paul Otlet realizes that Melvil Dewey’s Decimal Classification could be used to map knowledge domains. Begins work on converting Dewey’s system into the more faceted Universal Decimal Classification (UDC). 1918 – Otlet states again that the UDC may be used to create “an immense map of the domains of knowledge” (Otlet, 1918, p. 78). Rayword, B. (1994). Visions of Xanadu: Paul Otlet (1868-1944) and hypertext. JASIS, 45(4), 235-250. 1965 – Derek De Solla Price - published contemplation of using bibliometric techniques to create maps of scientific literatures. De Solla Price, Derek J. (1965). Networks of Scientific Papers Science, New Series, Vol. 149, No. 3683. (Jul. 30, 1965), pp. 510-515.
1964 Historiograph of DNA Development (Garfield, Sher, & Torpie, 1964) "The Use of Citation Data in Writing the History of Science." Published by The Institute for Scientific Information, December 1964. Report of research for Air Force Office of Scientific Research under contract F49(638)-1256. Eugene Garfield, recent photo. Creator of the ISI Web of Science citation database. http://www.garfield.library.upenn.edu/
1973 Co – Discoveries / Implementation Using Co-Citation to create domain maps. • Small, H. (1973). Co-citation in the scientific literature: A new measure of the relationship between two documents. JASIS, 24, 265-269. • Marshakova, I.V. (1973). A system of document connections based on references. Scientific and Technical Information Serial of VINITI, 6, 3-8.
(1875) Frank Shepard (1953) Eugene Garfield (1996) Page and Brin
Shepard’s Citations • 1875, Frank Shepard published his first citator, Illinois Citations. • He was a business person with no legal training. • Manual Hyperlinks.
Garfield’s Model For ISI • And in 1953 I learned, through William C. Adair, a former vice president of Shepard’s Citations, that there was an index to the case literature of the law that used citations. Shepard’s Citations is the oldest major citation index in existence; it was started in 1873 to provide the legal profession with a tool for searching legal decisions. … The legal “citator” system provided a model of how a citation index could be organized to function as an effective search tool. Garfield, Eugene (1979). Citation Indexing—Its Theory and Application In Science, Technology, and Humanities. Philadelphia: ISI Press. p.7.
: PageRank Relevance Algorithm • Developed by Stanford PhD Computer Science Students in 1996 • Larry Page and Sergey Brin • “Inspired by citation analysis, Page theorized that a raw count of links to a page would be a useful guide to the page’s rank.” Larry Page - 32 Battelle, John (2005). The Search: How Google and Its Rivals Rewrote the Rules of Business and Transformed Our Culture. Portfolio: New York Sergey Brin - 32
Law -- Attribution with Precision • Legal style guide for citations is a 300+ page book known as the Bluebook • Tradition of Student Edited Journals • Extensive Cite Checking and Validation • Does Not Rest on the Credibility of the Author • Every non-obvious original thought is attributed to a specific page or paragraph.
Example Citations (Case) • We examine the posture of respondent's cause of action first by viewing it as stating a claim under the Just Compensation Clause. This Court often has referred to regulation that "goes too far," Pennsylvania Coal Co. v.Mahon, 260 U.S. 393, 415, 43 S.Ct. 158, 160, 67 L.Ed. 322 (1922), as a "taking." See, e.g., Ruckelshaus v. Monsanto Co., 467 U.S. 986, 1004-1005, 104 S.Ct. 2862, 2873-2874, 81 L.Ed.2d 815 (1984); Agins v. Tiburon, 447 U.S., at 260, 100 S.Ct., at 2141;PruneYard Shopping Center v. Robins, 447 U.S. 74, 83, 100 S.Ct. 2035, 2041, 64 L.Ed.2d 741 (1980); Kaiser Aetna v. United States, 444 U.S. 164, 174, 100 S.Ct. 383, 390, 62 L.Ed.2d 332 (1979); Andrus v. Allard, 444 U.S. 51, 65-66, 100 S.Ct. 318, 326-327, 62 L.Ed.2d 210 (1979); Penn Central Transp. Co. v. New York City, 438 U.S. 104, 124, 98 S.Ct. 2646, 2659, 57 L.Ed.2d 631 (1978); Goldblatt v. Hempstead, 369 U.S. 590, 594, 82 S.Ct. 987, 990, 8 L.Ed.2d 130 (1962); United States v. Central Eureka Mining Co., 357 U.S. 155, 168, 78 S.Ct. 1097, 1104, 2 L.Ed.2d 1228 (1958). • Even assuming that those decisions meant to refer literally to the Taking Clause of the Fifth Amendment, and therefore stand for the proposition that regulation may effect a taking for which the Fifth Amendment requires just compensation, see San Diego, 450 U.S., at 647-653, 101 S.Ct., at 1302-1304 (dissenting opinion), and even assuming further that the Fifth Amendment requires the payment of money damages to compensate for such a taking, the jury verdict in this case cannot be upheld.
Process of KDV Creation and Usage Creation Domain Characteristics (Citation Networks, Coauthor Networks, Topic Co-occurrence, etc.) Domain Cartography (Production of the Domain Map) Domain Map (Physical Object) Cognitive Understanding (Content integrated with user’s previous knowledge) Visual Perception (Domain map viewed by user) Use Hook, Peter A. and Börner, Katy. (in press) Educational Knowledge Domain Visualizations: Tools to Navigate, Understand, and Internalize the Structure of Scholarly Knowledge and Expertise. In Amanda Spink and Charles Cole (eds.) New Directions in Cognitive Information Retrieval. Springer-Verlag. http://ella.slis.indiana.edu/~pahook/product/05-educ-kdvis.pdf
Benefits of the Big Picture • Provides a structure or scaffolding that students may use to organize the details of a particular subject. • Information is better assimilated with the student’s existing knowledge. • Visualization enhances recall. • Makes explicit the connections between conceptual subparts and how they are related to the whole. • Helps to signal to the student which concepts are most important to learn.
Co-Occurrence of West Topics in Supreme Court Cases 2004 While grouped in different West categories (blue = Crimes, green = Remedies), it appears that Criminal Law more closely relates to some Remedies topics than Crimes topics. Color Code: 1. Persons Node Size ~ Number of times topic appears in the dataset 2. Property 3. Contracts 4. Torts 5. Crimes Node Color ~ West Category 6. Remedies 7. Government
2004 Supreme Court Term – West Topics (All Topics – All Cases)
Frequency of Voting Blocks in 5-4 Cases(1994 -2003 Supreme Court Terms) 47% 16% 8% ALL OTHER GROUPINGS OF 5(34 different groupings) (Highest repetition – 3 times) 29% Total 5 to 4 Cases = 175 Source: Statistics harvested from the Harvard Law Review