Download

1 / 29
290 likes | 384 Views
Explore a novel approach for fast and interactive spatial joins in geographic information systems using probabilistic and sampling techniques. Visualize query results and control query processing to enhance decision support.

E N D
An Interactive Framework for Raster Data Spatial Joins Wan Bae (Computer Science, University of Denver) Petr Vojtěchovský (Mathematics, University of Denver) Shayma Alkobaisi (Computer Science, University of Denver) Scott T. Leutenegger (Computer Science, University of Denver) Seon Ho Kim (Computer Science, University of Denver)
Outline • Introduction • Issues and Problems • Probabilistic Joins • Sampling Joins • Interactive Framework • Experiments • Conclusion
Geographic Information Systems • Integration of georeferenced data • Spatial queries • Complex spatial data analysis & • modeling for decision support data data Web application GIS data data Web application • Collect • Store • Retrieve Users data data
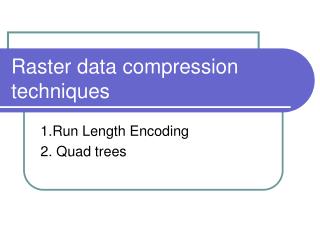
Raster Data Model • A great portion of georeferenced data • Simple data structure but greater storage space • Continuously changing data (a) Satellite Image (b) Raster Model
Raster Data Spatial Joins (a) (b) • “Find the regions where rainfall rate is greater than 1.0 • and wind speed is greater than 50”
Issues for User-driven Data Exploration • Fast Query response time • Time consuming for exact answers due to large size of data sets • Time intensive GIS decision support queries • Lack of optimization and approximation techniques for raster data joins • Interactive query processing • Lack of interactivities in traditional GIS • No user control over query processing • Visualization increases the utility of the GIS
Our Approach For faster and more effective decision support queries: • Fast approximation of query results 1. probabilistic join 2. sampling join • Visualize intermediate results 1. “big picture” of query result 2. partial result: non-blocking joins • Allow users to control query processing
Our Approximations • What is the probability that R joins S? R (8/16) S (9/16) = they must join! 2. Can use the result of a subset of data cell joins for the final answer? 1 joins / 2 cells ? / 16 cells
Augmented Quad-trees NW NE NW NE SE SE SW SW Both data sets are indexed using Quad-trees
Join Probability • Let X = [0, 1], m and n be randomly chosen intervals in X of length a, b. The probability p that m∩n≠ 0 Join Probability of p (m ∩ n ≠ 0) = ?
0 1 1-a a p a a1 a2 m overlapped b b1 b2 n x x+b b 1-b q 1-d Join Probability
n m b b2 a a2 b1 a1 2-d Join Probability 1 1 0
p( , ) p( , ) Probabilistic Join (PJ)
Probabilistic Join Result (a) data set Q (65536 x 65536) (b) data set S (65536 x 65536) (e) 4th level joins (d) 3th level joins (c) 2th level joins
Incremental Stratified Sampling Join (ISSJ) • Utilize stratified random sampling technique from quad- trees of two data sets R and S • Data randomization: Acceptance/Rejection method 1.Sampling step: sample data from outer data set R • Spatial joining step: joins with the corresponding data cell on inner data set S • Refining step: running estimates and confidence intervals 4. Visualization: display partial results (actual join results)
Stratified Random Sampling ST1 ST2 ST3 ST4 1 2 0 2 ST4 ST1 ST3 ST2
Population Proportion: fraction indicating the part of the sample having a particular interest Estimated Value: the statistic computed from sample information using population proportion Confidence interval: an interval that estimates a population parameter within a range of possible values at specified probability Confidence level: the specified probability Estimates and Confidence Interval
state airports confidence interval IA 95 22 0.05 95 0.05 NE 19 95 0.05 WI 15 95 0.05 13 CO 0.05 KS 11 95 MI 8 95 0.05 10% done Incremental Sampling Join Result (a) Estimated result (b) Partial result
Experiments • PJ and ISSJ compared to full Quad-tree join. • Confidence level set to 95% in ISSJ • Varied buffer size and data sets size. • Data sets: • Synthetic: UE, EU, UU (65536 65536 and 262144 262144) • Real: 6 data sets mineral resources for each state of AZ, CO, OR and WY from U.S. Geological Survey (65536 65536)
Accuracy of Estimates of ISSJ number of processed cells Estimates vs. exact value for real data sets
Time for Confidence Interval of ISSJ sampling join full quad-tree join Confidence Interval and I/Os for real data sets
ISSJ vs. PJ vs. Actual joins (a) ISSJ w/10% CI (b) ISSJ w/5% CI (d) PJ (a) Actual join
Time for Confidence Intervals I/Os of PJ, ISSJ and the full quad-tree join for Colorado
Conclusion • A novel spatial join, Probabilistic Join, for raster data joins for obtaining a “big picture” visualization of query answer • An interactive raster spatial join algorithm, Incremental Refining Spatial Join, for confidence interval bounded estimated query answer of raster data joins