Download
1 / 1
10 likes | 105 Views
http://yosemite.epa.gov/oar/globalwarming.nsf/content/index.html. Modeling Climate Change in the Classroom Rachel Loehman 1,2 , Lisa Blank 2 , and Jeff Crews 2 1 Numerical Terradynamic Simulation Group, The University of Montana, Missoula, MT

E N D
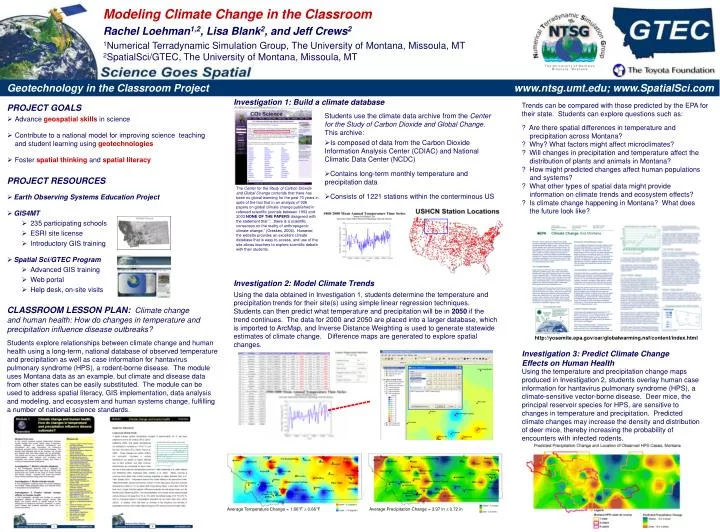
http://yosemite.epa.gov/oar/globalwarming.nsf/content/index.htmlhttp://yosemite.epa.gov/oar/globalwarming.nsf/content/index.html Modeling Climate Change in the Classroom Rachel Loehman1,2, Lisa Blank2, and Jeff Crews2 1Numerical Terradynamic Simulation Group, The University of Montana, Missoula, MT 2SpatialSci/GTEC, The University of Montana, Missoula, MT Geotechnology in the Classroom Project www.ntsg.umt.edu; www.SpatialSci.com Investigation 1: Build a climate database Trends can be compared with those predicted by the EPA for their state. Students can explore questions such as: PROJECT GOALS Students use the climate data archive from the Center for the Study of Carbon Dioxide and Global Change. This archive: • Is composed of data from the Carbon Dioxide Information Analysis Center (CDIAC) and National Climatic Data Center (NCDC) • Contains long-term monthly temperature and precipitation data • Consists of 1221 stations within the conterminous US • Advance geospatial skills in science • Contribute to a national model for improving science teaching and student learning using geotechnologies • Foster spatial thinking and spatial literacy ? Are there spatial differences in temperature and precipitation across Montana? ? Why? What factors might affect microclimates? ? Will changes in precipitation and temperature affect the distribution of plants and animals in Montana? ? How might predicted changes affect human populations and systems? ? What other types of spatial data might provide information on climate trends and ecosystem effects? ? Is climate change happening in Montana? What does the future look like? PROJECT RESOURCES The Center for the Study of Carbon Dioxide and Global Change contends that there has been no global warming for the past 70 years in spite of the fact that in an analysis of 928 papers on global climate change published in refereed scientific journals between 1993 and 2003 NONE OF THE PAPERS disagreed with the statement that “…there is a scientific consensus on the reality of anthropogenic climate change.” (Oreskes, 2004). However, the website provides an excellent climate database that is easy to access, and use of the site allows teachers to explore scientific debate with their students. • Earth Observing Systems Education Project • GIS4MT • 235 participating schools • ESRI site license • Introductory GIS training • Spatial Sci/GTEC Program • Advanced GIS training • Web portal • Help desk, on-site visits Investigation 2: Model Climate Trends Using the data obtained in Investigation 1, students determine the temperature and precipitation trends for their site(s) using simple linear regression techniques. Students can then predict what temperature and precipitation will be in 2050 if the trend continues. The data for 2000 and 2050 are placed into a larger database, which is imported to ArcMap, and Inverse Distance Weighting is used to generate statewide estimates of climate change. Difference maps are generated to explore spatial changes. CLASSROOM LESSON PLAN: Climate change and human health: How do changes in temperature and precipitation influence disease outbreaks? Students explore relationships between climate change and human health using a long-term, national database of observed temperature and precipitation as well as case information for hantavirus pulmonary syndrome (HPS), a rodent-borne disease. The module uses Montana data as an example, but climate and disease data from other states can be easily substituted. The module can be used to address spatial literacy, GIS implementation, data analysis and modeling, and ecosystem and human systems change, fulfilling a number of national science standards. Investigation 3: Predict Climate Change Effects on Human Health Using the temperature and precipitation change maps produced in Investigation 2, students overlay human case information for hantavirus pulmonary syndrome (HPS), a climate-sensitive vector-borne disease. Deer mice, the principal reservoir species for HPS, are sensitive to changes in temperature and precipitation. Predicted climate changes may increase the density and distribution of deer mice, thereby increasing the probability of encounters with infected rodents. Average Temperature Change = 1.66°F 0.66°F Average Precipitation Change = 3.97 in 0.72 in