Download
1 / 8
80 likes | 92 Views
The Phase Diagram of FeO. Rebecca A. Fischer 1 , Andrew J. Campbell 1 , Oliver T. Lord 2 , Gregory A. Shofner 3 , Przemyslaw Dera 4 , and Vitali B. Prakapenka 4. 1 Department of the Geophysical Sciences, University of Chicago 2 Department of Earth Sciences, University College London

E N D
The Phase Diagram of FeO Rebecca A. Fischer1, Andrew J. Campbell1, Oliver T. Lord2, Gregory A. Shofner3, Przemyslaw Dera4, and Vitali B. Prakapenka4 1Department of the Geophysical Sciences, University of Chicago 2Department of Earth Sciences, University College London 3Department of Geology, University of Maryland 4Center for Advanced Radiation Sources, University of Chicago 15 June 2011 COMPRES Annual Meeting Photo credit: Calvin Hamilton
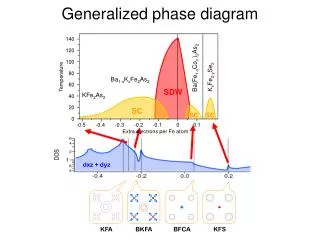
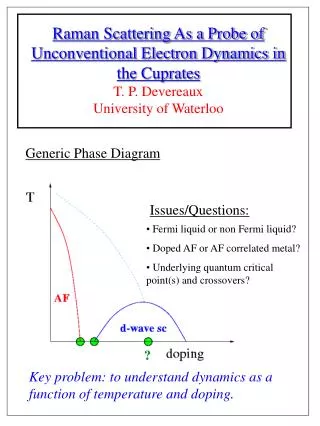
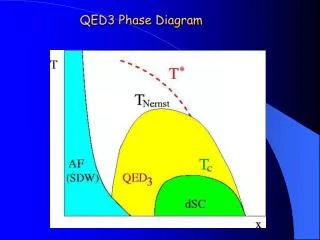
Current Phase Diagram of FeO melt B1/B8 boundary has a positive slope B1-B8-rhombohedral triple point would violate Schreinemaker’s rules B1 B8-LS B8-HS rhombohedral
Electrical Resistivity of FeO melt metal insulator B1 Shock wave data show that B1-FeO becomes metallic at high pressures and temperatures Knittle et al. (1986) Ohta et al. (2010) B8-LS B8-HS rhombohedral
Radiometric Methods • Four-color temperature imaging system (Campbell, 2008) • Phase transition identified from discontinuities in temperature-emissivity relationship 59 GPa 50 GPa
NaCl 110 Fe 102 B1 FeO 220 B1 FeO 200 Fe 110 B1 FeO 311 B1 FeO 222 NaCl 200 B1 FeO 111 B1 FeO 400 NaCl 220 NaCl 211 Fe 101 Fe 100 NaCl 100 X-Ray Diffraction Methods • Laser-heated diamond anvil cell experiments at sector 13-ID-D of APS • Isostructural transition • 0.3% average volume drop in FeO across the transition 65-70 GPa
Results: Phase Boundary in FeO Agreement between optical, XRD, and shock wave methods melt B1 metal B1 insulator Knittle et al. (1986)
Results: Phase Diagram of FeO melt Numerous datasets from several different research groups Thermodynamically self-consistent B1 metal B1 insulator B8 LS B8 HS rhombohedral
Conclusions • FeO undergoes an insulator-metal transition at high pressures and temperatures • Agreement between different experimental methods defining the B1 insulator/metal boundary • B1 metal is stable at P-T conditions of the lower mantle and outer core • Implications for ferropericlase stability, lower mantle conductivity, Fe-O bond at high pressures melt B1 metal B1 insulator B8 LS B8 HS rhombohedral Come see my poster this afternoon! Acknowledgements: NSF, NSF-GRFP, GSECARS, APS, COMPRES