Download
1 / 1
10 likes | 138 Views
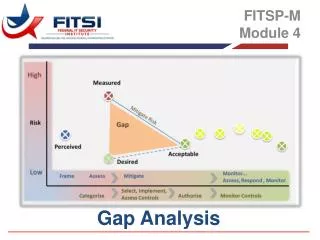
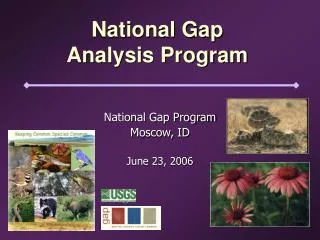
Ecoregions. Landcover. Rivers. IRIS. Watersheds. Land Stewardship. GAP Schematic. Landcover Mapping Vegetation Classification Image Analysis Landcover Map. Vertebrate Modeling Distribution Maps Vertebrate Models Habitat Prediction Maps. Predicted Habitat Distribution Vs

E N D
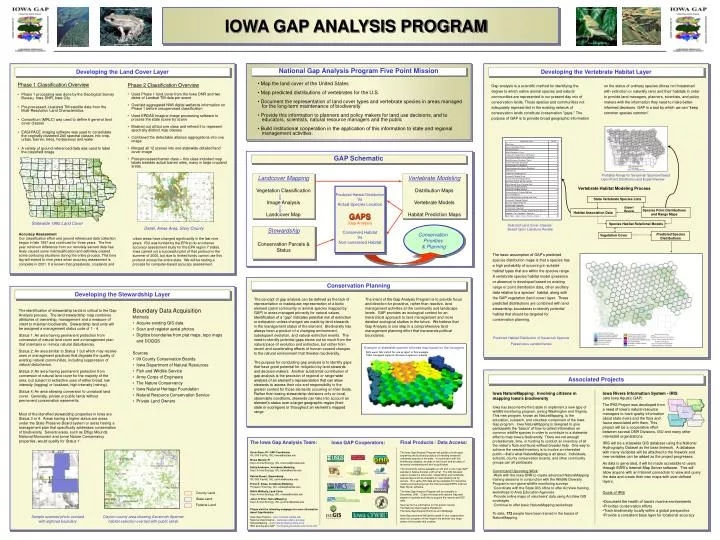
Ecoregions Landcover Rivers IRIS Watersheds Land Stewardship GAP Schematic Landcover Mapping Vegetation Classification Image Analysis Landcover Map Vertebrate Modeling Distribution Maps Vertebrate Models Habitat Prediction Maps Predicted Habitat Distribution Vs Actual Species Location GAPS (Gap Analysis) Conserved Habitat Vs Non-conserved Habitat Conservation Priorities & Planning Stewardship Conservation Parcels & Status Conservation Planning Developing the Stewardship Layer The concept of gap analysis can be defined as the lack of representation or inadequate representation of a biotic element (plant community or animal species mapped by GAP) in areas managed primarily for natural values. Identification of a “gap” indicates potential risk of extinction or extirpation unless changes are made by land stewards in the management status of the element. Biodiversity has always been a product of a changing environment, subsequent evolution, and natural extinction events. The need to identify potential gaps stems not so much from the natural pace of evolution and extinction, but rather from recent and accelerating effects of human-caused changes to the natural environment that threaten biodiversity. The purpose for conducting gap analysis is to identify gaps that have great potential for mitigation by land stewards and decision-makers. Another substantial contribution of gap analysis is the provision of regional or range-wide analysis of an element’s representation that can allow stewards to assess their role and responsibility in the greater context for those elements occurring on their lands. Rather than basing stewardship decisions only on local, observable conditions, stewards can take into account an element’s status over a larger geographic region (their state or ecoregion) or throughout an element’s mapped range. The intent of the Gap Analysis Program is to provide focus and direction for proactive, rather than reactive, land management activities at the community and landscape levels. GAP provides an ecological context for an hierarchical approach to land management and more detailed ecological studies in the future. We believe that Gap Analysis is one step in a comprehensive land management planning effort that transcends political boundaries. • Boundary Data Acquisition • Methods • Acquire existing GIS data • Scan and register aerial photos • Digitize boundaries from plat maps, topo maps and DOQQS • Sources • 99 County Conservation Boards • Iowa Department of Natural Resources • Fish and Wildlife Service • Army Corps of Engineers • The Nature Conservancy • Iowa Natural Heritage Foundation • Natural Resource Conservation Service • Private Land Owners The identification of stewardship lands is critical to the Gap Analysis process. The land stewardship map combines attributes of ownership, management and a measure of intent to maintain biodiversity. Stewardship land units will be assigned a management status code of 1 - 4. Status 1: An area having permanent protection from conversion of natural land cover and a management plan that maintains or mimics natural disturbances. Status 2: An area similar to Status 1 but which may receive uses or management practices that degrade the quality of existing natural communities, including suppression of natural disturbance. Status 3: An area having permanent protection from conversion of natural land cover for the majority of the area, but subject to extractive uses of either broad, low intensity (logging) or localized, high intensity (mining). Status 4: An area allowing conversion to unnatural land cover. Generally, private or public lands without permanent conservation easements. Most of the identified stewardship properties in Iowa are Status 3 or 4. Areas having a higher status are areas under the State Preserve Board system or areas having a management plan that specifically addresses conservation of biodiversity. Several areas, such as Effigy Mounds National Monument and some Nature Conservancy properties, would qualify for Status 1. Example of statewide species richness map based on the hexagons Data were fabricated for use as input in this exampleTaller hexagons imply an increase in species richness Sample scanned photo overlaid with digitized boundary Clayton county area showing Savannah Sparrow habitat selection overlaid with public lands Iowa GAP Cooperators: The Iowa Gap Analysis Team: Kevin Kane, PI / GAP Coordinator ISU GIS Facility, ISU, kkane@iastate.edu Bruce Menzel, PIDept. Animal Ecology, ISU, bmenzel@iastate.edu Kathy Andersen, Vertebrate Modeling Dept. Animal Ecology, ISU, kafeb@iastate.edu Patrick Brown, Stewardship ISU GIS Facility, ISU, patrickb@iastate.edu Erwin E. Klaas, Vertebrate ModelingProfessor Emeritus, ISU, eklaas@iastate.edu Robin McNeely, Land Cover Dept. Animal Ecology, ISU, mobes@iastate.edu Jason O’brien, NatureMapping Dept. Animal Ecology, ISU, jpobrien@iastate.edu Please visit the following webpages for more information about Gap Analysis: Iowa Gap Analysis - www.iowagap.iastate.eduNational Gap Analysis - www.gap.uidaho.edu/gapNatureMapping - www.naturemapping.state.ia.usIRIS and Aquatic GAP - mombasa.gis.iastate.edu/iris/iris.htm Final Products / Data Access:The Iowa Gap Analysis Program will publish a final report explaining the biodiversity status of breeding terrestrial vertebrate species in the state. In conjunction with this biodiversity analysis, an atlas of land cover and an atlas of terrestrial vertebrates will also be published. The documents will be available on CD and on the Iowa GAP website in Adobe Acrobat .pdf format. The GIS datasets used to create the land cover, stewardship and vertebrate species layers will be available for downloading via ftp service. This same GIS data will be available for interactive viewing and querying over the Internet using ESRI’s Internet Map Server software. The Iowa Gap Analysis Program will be complete in December, 2001. Check the state and national Gap web pages for updates and links to acquire the reports and GIS data. Sources for the information on this poster include:The National Gap Analysis HandbookThe Iowa Gap Analysis Brochure and Webpage Iowa Gap personnel will gladly speak to your organization about our program; all we require are several very large plates of chocolate chip cookies. County Land State Land Federal Land www.herpnet.net/Iowa-Herpetology animaldiversity.ummz.umich.edu IOWA GAP ANALYSIS PROGRAM American Goldfinch Northern Leopard Frog Developing the Land Cover Layer National Gap Analysis Program Five Point Mission Developing the Vertebrate Habitat Layer • Phase 2 Classification Overview • Used Phase 1 land cover from the Iowa DNR and two dates of Landsat TM data per scene • Overlaid aggregated NWI digital wetlands information on Phase 1 before unsupervised classification • Used ERDAS Imagine image processing software to process the state scene by scene • Masked out all but one class and refined it to represent spectrally distinct map classes • Combined the detectable alliance aggregations into one image • Merged all 12 scenes into one statewide detailed land cover image • Post-processed barren class – this class included map labels besides actual barren sites, many in large cropland areas. • Map the land cover of the United States • Map predicted distributions of vertebrates for the U.S. • Document the representation of land cover types and vertebrate species in areas managed for the long-term maintenance of biodiversity • Provide this information to planners and policy makers for land use decisions, and to educators, scientists, natural resource managers and the public • • Build institutional cooperation in the application of this information to state and regional management activities. Phase 1 Classification Overview • Phase 1 processing was done by the Geological Survey Bureau, Iowa DNR, Iowa City • Pre-processed, clustered TM satellite data from the Multi-Resolution Land Characteristics • Consortium (MRLC) was used to define 6 general land cover classes • EASI/PACE imaging software was used to consolidate the originally clustered 240 spectral classes into crop, urban, barren, trees, herbaceous and water • A variety of ground referenced data was used to label the classified image Gap analysis is a scientific method for identifying the degree to which native animal species and natural communities are represented in our present-day mix of conservation lands. Those species and communities not adequately represented in the existing network of conservation lands constitute conservation "gaps." The purpose of GAP is to provide broad geographic information on the status of ordinary species (those not threatened with extinction or naturally rare) and their habitats in order to provide land managers, planners, scientists, and policy makers with the information they need to make better-informed decisions. GAP is a tool by which we can “keep common species common”. Probable Range for Savannah Sparrow Based Upon Point Distribution and Expert Review Vertebrate Habitat Modeling Process State Vertebrate Species Lists Expert Review Species Point Distributions and Range Maps Habitat Association Data Statewide 1992 Land Cover Species Habitat Relational Models Selected Land Cover Classes Based Upon Literature Review Detail, Ames Area, Story County Accuracy Assessment Our classification effort and ground referenced data collection began in late 1997 and continued for three years. The five year minimum difference from our remotely sensed data has likely caused some misclassification and definitely created some confusing situations during the entire process. This time lag will extend to nine years when accuracy assessment is complete in 2001. It is known that grasslands,croplands and Predicted Species Distributions Vegetation Cover urban areas have changed significantly in the last nine years. ISU was funded by the EPA to do an intense accuracy assessment study for the EPA region 7 states. Iowa carried out a successful pilot of that protocol in the summer of 2000, but due to limited funds cannot use this protocol across the entire state. We will be testing a process for computer-based accuracy assessment. The basic assumption of GAP’s predicted species distribution maps is that a species has a high probability of occurring in suitable habitat types that are within the species range. A vertebrate species habitat model (presence or absence) is developed based on existing range or point distribution data, other ancillary data relative to a species’ habitat, along with the GAP vegetation (land cover) layer. These predicted distributions are combined with land stewardship boundaries to identify potential habitat that should be targeted for conservation planning. Predicted Habitat Distribution of Savannah Sparrow Passerculus sandwichensis Associated Projects Iowa NatureMapping: Involving citizens in mapping Iowa's biodiversity Iowa has become the third state to implement a new type of wildlife monitoring program, joining Washington and Virginia. This new program, known as NatureMapping, is the education, outreach, and volunteer component of the Iowa Gap program. Iowa NatureMapping is designed to give participants the “basics” of how to collect information on common wildlife species in order to contribute to a statewide effort to map Iowa’s biodiversity. There are not enough professionals, time, or funding to conduct an inventory of all the nation’s flora and fauna without broader help. One way to achieve the needed inventory is to involve an interested public—that’s what NatureMapping is all about. Individuals, schools, county conservation boards, and other community groups can all participate. Current and Upcoming Work: ·Work with the Iowa DNR to create advanced NatureMapping training sessions in conjunction with the Wildlife Diversity Program's non-game wildlife monitoring surveys ·Coordinate with the State GIS office to offer ArcView training workshops to Area Education Agencies ·Provide online maps of volunteers' data using ArcView GIS coverages ·Continue to offer basic NatureMapping workshops To date, 172 people have been trained in the basics of NatureMapping. • Iowa Rivers Information System - IRIS(aka Iowa Aquatic GAP) • The IRIS Project was developed froma need of Iowa’s natural resourcemanagers to have quality informationabout state rivers and the flora andfauna associated with them. This project will be a cooperative effort between several DNR Divisions, ISU and many other interested organizations. • IRIS will be a statewide GIS database using the National Hydrography Dataset as the base linework. A database with many variables will be attached to the linework and new variables can be added as the project progresses. • As data is generated, it will be made accessible to users through ESRI’s Internet Map Server software. This will allow anyone with an Internet connection to view and query the data and create their own maps with user-defined layers. • Goals of IRIS • Document the health of Iowa’s riverine environments • Prioritize conservation efforts • Track biodiversity locally within a global perspective • Provide a consistent base layer for locational accuracy