Download
1 / 83
840 likes | 1.02k Views
Iowa Gap Analysis Program. 1998 Program Status Meeting Iowa State University, Memorial Union October 27, 1998. Agenda. 9:30 - 10:00 Coffee 10:00 - 10:15 Welcome and Overview of Meeting, Erv Klaas 10:15 - 10:30 Vegetation Classification, John Pearson

E N D
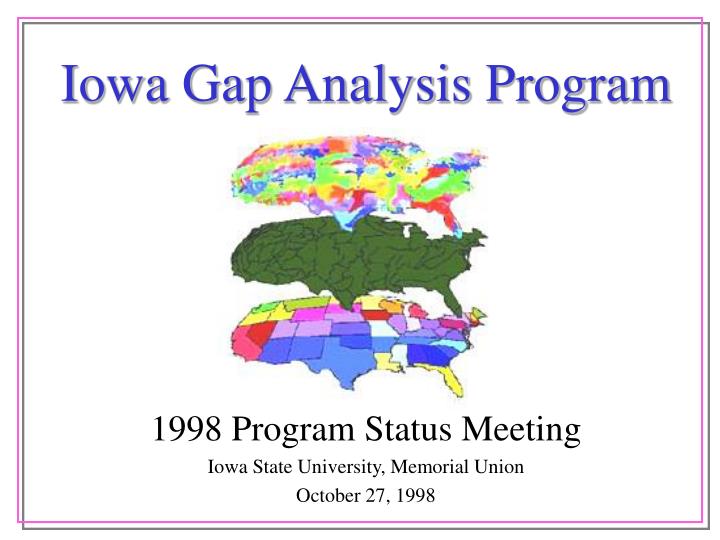
Iowa Gap Analysis Program 1998 Program Status Meeting Iowa State University, Memorial Union October 27, 1998
Agenda 9:30 - 10:00Coffee 10:00 - 10:15Welcome and Overview of Meeting,Erv Klaas 10:15 - 10:30Vegetation Classification,John Pearson 10:30 - 10:55Landcover (Phase 1),Jim Giglierano 10:55 - 11:20Landcover (Phase 2),Erv Klaas, Robin McNeely 11:20 - 11:40Accuracy Assessment,Erv Klaas 11:40 - 12:00Land Stewardship,Patrick Brown 12:00 - 1:00Lunch (on your own) 1:00 - 1:30Vertebrate Modeling,Kathy Andersen, Erv Klaas 1:30 - 1:50NatureMapping,Jim Pease 1:50 - 3:00Role of Gap Analysis in Conservation Planning, Erv Klaas
Welcome and Overview Erv Klaas
National Gap Analysis Program The Gap Analysis Program has a four point mission • Map the land cover of the United States • Map predicted distributions of vertebrates for the U.S. • Document the representation of land cover types and vertebrate species in areas managed for the long-term maintenance of biodiversity • Provide this information to planners and policy makers for land use decisions, and to educators, scientists, natural resource managers and the public
Landcover (Phase 1) Jim Giglierano
Landcover (Phase 2) Erv Klaas & Robin McNeely
Classified Landcover (draft) near Effigy Mounds, Allamakee County, IA
(Phase 2) Classification Overview • Use Phase 1 landcover created by Jim Giglierano and at least two dates of Landsat TM data per scene • Use ERDAS Imagine image processing software • Process the landcover scene by scene • Mask out all but one class and refine it to represent the spectrally distinct alliances • Combine all the detectable alliances into one image • Mosaic all 12 scenes into one statewide detailed landcover image
General Classification Process • Select one Phase 1 class to work with • Overlay ground referenced data on the satellite image and gather spectral signatures for expected alliances • Run a supervised classification on the image using the gathered signatures as a guide for the software to assign alliances • Check the classified image with ground referenced points not used to gather signatures • Run the classification again to break up confused classes
General Classification Process • Supervised classification will be used on the forest, woodland and grassland classes • Unsupervised classification will be used on the upland shrub and urban classes • Barren, cropland and open water classes will not be processed further • Wetland alliances will be represented by aggregated NWI class data
Aggregation of NWI Wetland Data • Wetland classes are simplified by aggregating NWI codes according to hydrology • This corresponds to the widely recognized wetland classes of temporary, seasonal, semi-permanent, saturated and permanent • This system is also being followed in the national vegetation classification system
Potential Final Products for Landcover • CD containing alliance-level landcover by county as shapefile, ArcInfo coverage or ArcInfo export file (.e00) • FTP site for downloading the same data • Printed color maps of county and statewide alliance-level landcover • Text report detailing the classification process, vegetation alliance descriptions and coverage metadata
GAP Conservation Status Codes Status 1: Area with permanent protection from conversion following a management plan that allows or mimics disturbance events Status 2: Area with permanent protection from conversion following a management plan but allows practices degrading natural communities Status 3: Area with permanent protection from conversion for majority of land but allowing extractive uses Status 4: Area lacking irrevocable mandate to prevent conversion of natural land cover and allowing intensive use of the area
Accuracy Assessment Erv Klaas
Vegetation Classification John Pearson
History of Vegetation Classification Efforts in Iowa, 1981-1998John Pearson
Ecologists for state and regional community classification efforts • 1981-1983 Laushman/White • 1984 Schennum/White • 1985-1992 Pearson/Chapman • 1993-1998 Pearson/Faber-Langendoen
John White (1981-1984)“Natural Communities” • Originated in Illinois Natural Areas Inventory • Based on physiognomy, vegetation, substrate, moisture • Named after most conspicuous features; not dominant species • Adaptation of Curtis’ Vegetation of Wisconsin • Example: “Dry Limestone Prairie” • Wide variation among states
Kim Chapman (1985-1992)“Regional Community Types” • “Umbrella” approach • State types unchanged • Regional types named for local environmental factors (nutrients, moisture, physiognomy) and geographic area • “Fertile, Well Drained Shrub/Herb Communities, Midwest Type” or “High Prairie, Midwest Type”
Don Faber-Langendoen (1993- )“Alliances” • Coordinated with national classification • Shift to plant associations named after dominant species in natural vegetation • “Schizachyrium scoparium-Bouteloua curtipendula Herbacaeous Alliance” • Midwest summary completed in 1997 • Adjustments for state classifications
Roger Laushman/Wayne Schennum (1981-1984) • “Natural Community” approach of White • 30 types for Iowa • Some units broad: “Blacksoil Prairie”, “Clay Loam Prairie”, “Upland Forest” • Some units specific: “Gravel Prairie”, “Sand Prairie”, “Fen”
John Pearson et al.(1985-1998) • 1985 state revision • 1987 regional revision • 1993 regional revision • 1997 regional summary • 1998 review for Gap Analysis
1987 and 1993 seminars • Convened to adapt state classification to new regional models • Participants: Tom Blewett, Ed Cawley, Paul Christiansen, Larry Eilers, Don Farrar, Susan Galatowitch, David Glenn-Lewin, Diana Horton, Dean Roosa, Tom Rosburg, Jerry Selby, Daryl Smith, Paul Whitson
1987 Seminar Natural Communities Environment Curtis State/Region 1993 Seminar Alliances Vegetation Daubenmire State/Region/Nation Comparison of 1987 and 1993 seminars
Conservation Priority Index • Includes percentage of protected land, percentage of land converted to development or agriculture and a weighting factor for zone size • De-emphasizes minor zones and takes into account the amount of a zone already converted from natural cover • Zones with the highest CPI have little remaining undeveloped or uncultivated land CPI = ((100 - % protected)/(100 - % converted))* log (total area in the zone)
Challenges for Gap Analysis • “Idealized” classification with many finely defined units • Data management problem of tracking fine-scale units in diverse landscapes • “Real world” constraints of lack of field data and coarse scale of remote sensing • Modifications to classifications must still meet interstate compatibility needs
Land Stewardship Patrick Brown
Land Stewardship • Identify key land management agencies • Develop a map which details the spatial relationship of existing conservation areas • Attribute a management status code for eachproperty
Land Management Agencies • 99 County Conservation Boards • Iowa Department of Natural Resources • Fish and Wildlife Service • Army Corps of Engineers • The Nature Conservancy • Iowa Natural Heritage Foundation • Natural Resource Conservation Service • Private Land Owners
Boundary Data Acquisition • Aerial Photos • Existing GIS data • Plat maps/aerial photos • 7.5’ topo maps
Management Status • Based on • management plan or intent • primary use of land • amount of land managed for “natural land cover” • protection from conversion • inclusiveness of management • type of management
Status Categories HighestLowest
Vertebrate Modeling Kathy Andersen
VertebrateHabitat Modeling Process State Vertebrate Species Lists Species Point Distributions and Range Maps Habitat Association Data Expert Review Species Habitat Relational Models Vegetation Cover Predicted Species Distributions
State Vertebrate Species Lists Species Source Amphibians & Reptiles Dr. James Christiansen Drake University Birds Iowa Breeding Bird Survey Mammals Mammals of Iowa:Holocene to the end of the20th Century, by J. B. Bowles, D. I. Howell, R.P. Lampe, and H.P. Whidden, 1998. Journal of Iowa Academy of Science. Visit the Iowa Gap Project Homepage: http://www.ag.iastate.edu/centers/cfwru/iowagap/
S o u t h e r n F l y i n g S q u i r r e l ( G l a u c o m y s v o l a n s ) T $ S F l y i n g S q u i r r e l T $ R i v e r s T T $ $ N E I o w a C o u n t i e s T $ A l l a m a k e e W i n n e s h i e k S o u r c e : D r . J o h n B . B o w l e s N $ T $ T W E F a y e t t e C l a y t o n S : Mammals Species Point Distributions