Download
1 / 24
250 likes | 270 Views
Dimension Reduction PCA and tSNE. v2019-06.2 Simon Andrews simon.andrews@babraham.ac.uk. Where are we heading?. Each dot is a cell Groups of dots are similar cells Separation of groups could be interesting biology. Too much data!. 5000 cells and 2500 measured genes

E N D
Dimension ReductionPCA and tSNE v2019-06.2 Simon Andrews simon.andrews@babraham.ac.uk
Where are we heading? Each dot is a cell Groups of dots are similar cells Separation of groups could be interesting biology
Too much data! • 5000 cells and 2500 measured genes • Realistically only 2 dimensions we can plot (x,y)
Principle Components Analysis • Method to optimally summarise large multi-dimensional datasets • Can find a smaller number of dimensions (ideally 2) which retain most of the useful information in the data • Builds a recipe for converting large amounts of data into a single value, called a Principle Component (PC), eg: PC = (GeneA*10)+(GeneB*3)+(GeneC*-4)+(GeneD*-20)…
Principle Components Analysis • Method to optimally summarise large multi-dimensional datasets • Can find a smaller number of dimensions (ideally 2) which retain most of the useful information in the data • Builds a recipe for converting large amounts of data into a single value, called a Principle Component (PC), eg: PC = (GeneA*10)+(GeneB*3)+(GeneC*-4)+(GeneD*-20)…
How does PCA work? • Simple example using 2 genes and 10 cells
How does PCA work? • Find line of best fit, passing through the origin
Assigning Loadings to Genes Loadings: • Gene1 = 0.82 • Gene2 = 0.57 Higher loading equals more influence on PC Single Vector or ‘eigenvector’
More dimensions • The same idea extends to larger numbers of dimensions (n) • Calculation of first PC rotates in (n-1) -dimensions • Next PC is perpendicular to PC2, but rotated similarly (n-2) • Last PC is remaining perpendicular (no choice) • Same number of PCs as genes
Explaining Variance • Each PC always explains some proportion of the total variance in the data. Between them they explain everything • PC1 always explains the most • PC2 is the next highest etc. etc. • Since we only plot 2 dimensions we’d like to know that these are a good explanation • How do we calculate this?
Explaining variance • Project onto PC • Calculate distance to the origin • Calculate sum of squared differences (SSD) • This is a measure of variance called the ‘eigenvalue’ • Divide by (points-1) to get actual variance PC1 PC2
So PCA is great then? • Kind of…
So PCA is great then? • Kind of…
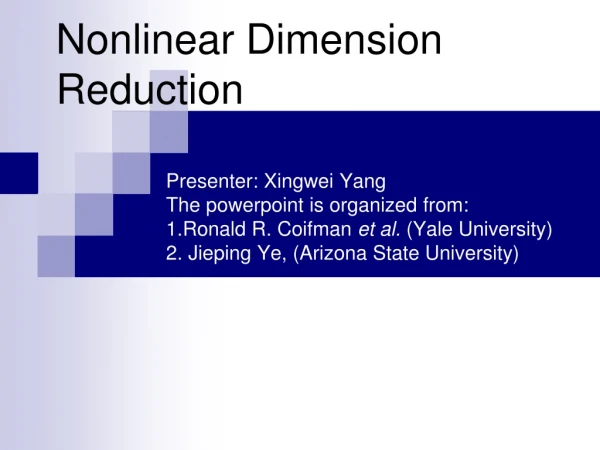
tSNE to the rescue… • T-Distributed Stochastic Neighbour Embedding • Aims to solve the problems of PCA • Non-linear scaling to represent changes at different levels • Optimal separation in 2-dimensions
How does tSNE work? • Based around all-vs-all table of pairwise distances
Distance scaling and perplexity • Perplexity = expected number of neighbours within a cluster • Distances scaled relative to perplexity neighbours
tSNE Projection • Normally 2D, but can be any number of dimensions • Randomly scatter all points within the space • Start a simulation • Aim is to make the point distances match the distance matrix • Shuffle points based on how well they match • Stop after fixed number of iterations, or • Stop after distances have converged
tSNE Projection • X and Y don’t mean anything (unlike PCA) • Distance doesn’t mean anything (unlike PCA) • Close proximity is highly informative • Distant proximity isn’t very interesting • Can’t rationalise distances, or add in more data
So tSNE is great then? • Kind of… • Imagine a dataset with only one super informative gene • Now 3 genes • Now 3,000 genes • Everything is the same distance from everything Distance within cluster = higher Distance between clusters = lower Distance within cluster = low Distance between clusters = high
So everything sucks? • PCA • Requires more than 2 dimensions • Thrown off by quantised data • Expects linear relationships • tSNE • Can’t cope with noisy data • Loses the ability to cluster Answer: Combine the two methods, get the best of both worlds • PCA • Good at extracting signal from noise • Extracts informative dimensions • tSNE • Can reduce to 2D well • Can cope with non-linear scaling
Practical PCA + tSNE • Filter heavily before starting • Nicely behaving cells • Expressed genes • Variable genes • Do PCA • Extract most interesting signal • Take top PCs. Reduce dimensionality (but not to 2) • Do tSNE • Calculate distances from PCA projections • Scale distances and project into 2-dimensions