Download
1 / 15
150 likes | 267 Views
Aerosol distribution and physical properties in the Titan atmosphere. D. E. Shemansky 1 , X. Zhang 2 , M-C. Liang 3 , and Y. L. Yung 2 1 SET/PSSD, California, USA ; 2 CIT California, USA ; 3 Res. Ctr. Env . Change, Taipei, Taiwan.

E N D
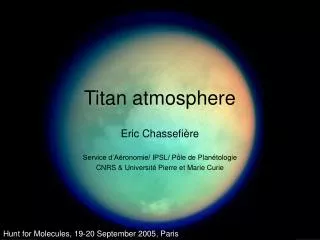
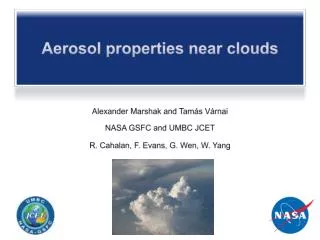
Aerosol distribution and physical properties in the Titan atmosphere D. E. Shemansky1, X. Zhang2, M-C. Liang3, and Y. L. Yung2 1 SET/PSSD, California, USA ; 2 CIT California, USA ; 3 Res. Ctr. Env. Change, Taipei, Taiwan
Extinction spectra in Cassini UVIS fuv stellar occultations show a continuum component with a spectral shape similar to the imaginary part of the refractive index obtained by Khare et al (1984) from deposits (tholin) in a laboratory discharge in an N2-CH4 gas mixture. • The UVIS fuv experiment also measures emission in scattered solar photons in the 1500 – 1900 A region, interpreted as Rayleigh scattering by tholin. • The combination of extinction optical depth and measured absolute scattered solar photons in the same upper thermosphere volume is then used to infer a scattering cross section .
Cassini T0 encounter with near 90o solar phase observing geometry
Cassini UVIS fuv emission spectrum from sub-solar 1040 km los at T0 Phase ~90o
Tholin vertical distribution extracted in stellar occultations at TB encounter
Calculated tholin physical properties using Mie scattering theory
Derived tholin densities from stellar occultations at TB and T41
Comparison of Cassini UVIS and Voyager 1 occultationphotometric inversions at ~1650 A
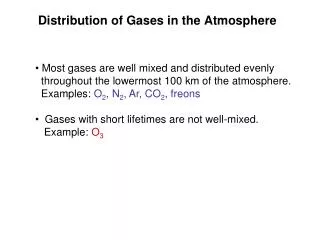
Global distribution • The high altitude thermosphere tholin content shows dependence on latitude. • The north and south polar regions have measureable tholin scattering only below 850 km compared to 1040 km at low latitude.
Titan TA encounter near 0o phase Multiple exposures with N/S planet centered UVIS slit
Solar reflection in the Cassini UVIS fuv spectrum at the T0 and TA encounters. T0 is a low latitude 90o phase sub solar los . TA is at 0o phase and scans all latitudes through planet center pole to pole.
Cassini UVIS fuv spectra at selected los impact parameters showing the absence of solar photon scattering at and above 875 km; TA encounter south pole region Cassini UVIS fuv spectra at selected los impact parameters showing the absence of solar photon scattering at and above 875 km; TA encounter south pole region
Cassini UVIS fuv spectra at selected los impact parameters showing the absence of solar photon scattering at and above 875 km; TA encounter north pole region
Comparison of the south pole region TA spectra with the UVIS simulated fuv solar model spectrum for zero extinction, normalized at 1850 A.
Conclusions • The combined Cassini UVIS occultation and emission measurements of aerosol properties in the Titan atmosphere allow determination of basic properties. The application of Mie theory with the Khare et al. tholin refractive index measurements are used for the calculation of a mean cross section and particle size (76A radius) at the top of the atmosphere ( 1040 km) at low latitude . • The derived vertical density profiles from several occultation events show two common deep vertical population depletions in the altitude range 700 – 800 km, and 400 – 500 km. The evidence indicates these features are persistent in location and depth on a ½ century scale based on comparison with Voyager results. • It is evident from profile scale height that the aerosols must be produced at high altitude and diffuse downward, consistent with ion chemistry production (Coates et al., 2007, 2010) . In addition the source must be a vertically distributed process; regeneration must occur below the depletion layers. The deep layered structure imposes limits on rate modeling. See Kammer et al. EPSC-DPS 2011-347 for relation to lower order hydrocarbons. • The polar regions show aerosol scattering to be undetectable above 800 km altitude, 200 km below the measured scattering at 1040 km at low latitude.