Download
1 / 75
760 likes | 1.1k Views
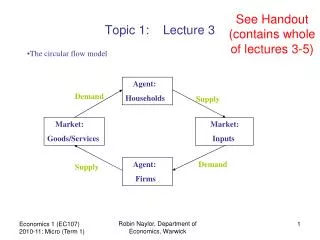
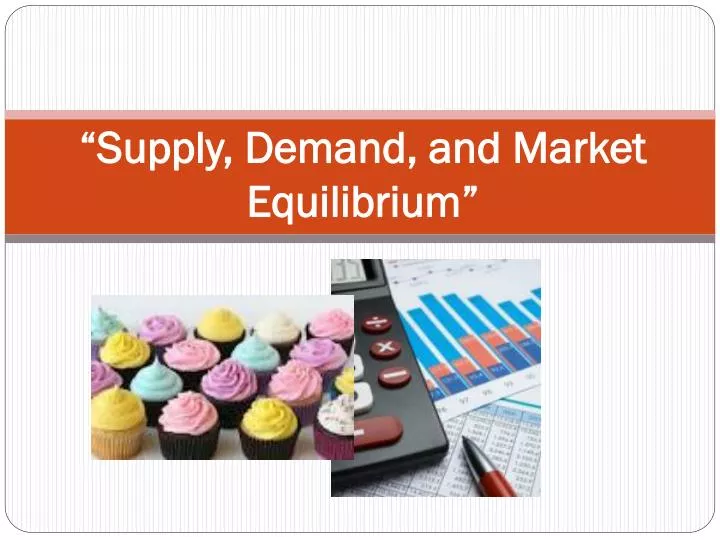
“Supply, Demand, and Market Equilibrium”. Introduction to Demand. In the United States, the forces of supply and demand work together to set prices. Demand is the desire, willingness, and ability to buy a good or service. one individual consumer OR

E N D
Introduction to Demand • In the United States, the forces of supply and demand work together to set prices. • Demand is the desire, willingness, and ability to buy a good or service. • one individual consumer OR • total demand of all consumers in the market (market demand).
Introduction to Demand • A demand schedule is a table that lists the various quantities of a product or service that someone is willing to buy over a range of possible prices.
Introduction to Demand • A demand schedule can be shown as points on a graph. • The graph lists prices on the vertical axis and quantities demanded on the horizontal axis. • Each point on the graph shows how many units of the product or service an individual will buy at a particular price. • The demand curve is the line that connects these points.
Introduction to Demand • The demand curve slopes downward. • This shows that people are normally willing to buy less of a product at a high price and more at a low price. • According to the law of demand, quantity demanded and price move in opposite directions.
Introduction to Demand • We buy products for their utility- the pleasure, usefulness, or satisfaction they give us. • What is your utility for the following products? (Measure your utility by the maximum amount you would be willing to pay for this product) • Do we have the same utility for these goods?
Introduction to Demand • One reason the demand curve slopes downward is due to diminish marginal utility • The principle of diminishing marginal utilitysays that our additional satisfaction tends to go down as we consume more and more units. • To make a buying decision, we consider whether the satisfaction we expect to gain is worth the money we must give up.
Introduction to Supply • A supply schedule is a table that shows the quantities producers are willing to supply at various prices
Introduction to Supply • Supply refers to the various quantities of a good or service that producers are willing to sell at all possible market prices. • Supply can refer to the: • output of one producer OR • to the total output of all producers in the market (market supply).
Introduction to Supply • A supply schedule can be shown as points on a graph. • The graph lists prices on the vertical axis and quantities supplied on the horizontal axis. • Each point on the graph shows how many units of the product or service a producer (or group of producers) would willing sell at a particular price. • The supply curve is the line that connects these points.
Introduction to Supply • As the price for a good rises, the quantity supplied rises and the quantity demanded falls. As the price falls, the quantity supplied falls and the quantity demanded rises. • The law of supply holds that producers will normally offer more for sale at higher prices and less at lower prices.
Introduction to Supply • Businesses provide goods and services hoping to make a profit. • Profit is the money a business has left over after it covers its costs. • Businesses try to sell at prices high enough to cover their costs with some profit left over. • The higher the price for a good, the more profit a business will make after paying the cost for resources.
Equilibrium • When quantity demand and quantity supplied are at the same price then they reach an equilibrium price • Equilibrium is ideal for producers because more of their product gets sold • Equilibrium is ideal for consumers because the right amount of product is available for the people who want it
Surplus • If supply exceeds demand there is a surplus • Price is too high so goods and services exchanged are limited by demand
Shortage • If demand exceeds supply, there will be a shortage • Price is too low so goods and services exchanged are limited by supply
Changes in Demand • Prices of related goods affect on demand • Substitute goods a substitute is a product that can be used in the place of another. • The price of the substitute good and demand for the other good are directly related • For example, Coke Price Pepsi Demand • Complementary goods a compliment is a good that goes well with another good. • When goods are complements, there is an inverse relationship between the price of one and the demand for the other • For example, Peanut Butter Jam Demand
Elasticity • Demand elasticity- market in which a change in price will automatically cause a change in demand (luxury goods with substitutes) • Demand inelasticity- market in which a change in price will not cause a significant change in demand (necessary good with no substitutes)
Changes in supply These occur due one or more of the following: • Cost of resources • Amount available • Productivity • Technology • Role of Government: Regulations, taxes, and subsidies- gov’t money to help production • Expectations
Pure competition • Identical products- no difference in product sold • commodity- an essential product that is the same regardless who makes or sells it
Changes in Supply Changes in any of the factors other than price causes the supply curve to shift either: • Decrease in Supply shifts to the Left (Less supplied at each price) OR • Increase in Supply shifts to the Right (More supplied at each price)
Introduction to Supply • The reason the supply curve slopes upward is due to costs and profit. • Producers purchase resources and use them to produce output. • Producers will incur costs as they bid resources away from their alternative uses.
Changes in Demand • Demand Curves can also shift in response to the following factors: • Buyers (# of): changes in the number of consumers • Income: changes in consumers’ income • Tastes: changes in preference or popularity of product/ service • Expectations: changes in what consumers expect to happen in the future • Related goods: compliments and substitutes • BITER: factors that shift the demand curve
Changes in Demand • Change in the quantity demanded due to a price change occurs ALONG the demand curve • An increase in the Price of Cupcakes from $3 to $4 will lead to a decrease in the Quantity Demanded of cupcakes from 6 to 4.
Changes in Demand • Several factors will change the demand for the good (shift the entire demand curve) • As an example, suppose consumer income increases. The demand for Widgets at all prices will increase.
Changes in Demand • Demand will also decrease due to changes in factors other than price. • As an example, suppose cupcakes become less popular to own.
Changes in Demand Changes in any of the factors other than pricecauses the demand curve to shift either: • Decrease in Demand shifts to the Left (Less demanded at each price) OR • Increase in Demand shifts to the Right (More demanded at each price)
Changes in Supply • Change in the quantity supplied due to a price change occurs ALONG the supply curve • If the price of Cupcakes fell to $2, then the Quantity Supplied would fall to 4 Cupcakes.
Changes in Supply • Supply Curves can also shift in response to the following factors: • Subsidies and taxes: government subsides encourage production, while taxes discourage production • Technology: improvements in production increase ability of firms to supply • Other goods: businesses consider the price of goods they could be producing • Number of sellers: how many firms are in the market • Expectations: businesses consider future prices and economic conditions • Resource costs: cost to purchase factors of production will influence business decisions • STONER: factors that shift the supply curve
Changes in Supply • Supply can also decrease due to factors other than a change in price. • As an example, suppose that a large number of Widget producers go out of business, decreasing the number of suppliers.
1. The income of the Pago-Pagans declines after a typhoon hits the island. Price D D1 Quantity
2. Pago-Pagan is named on of the most beautiful islands in the world and tourism to the island doubles. Price D1 D Quantity
3. The price of Frisbees decreases. (Frisbees are a substitute good for boomerangs) Price D D1 Quantity
4. The price of boomerang t-shirts decreases, which I assume all of you know are a complementary good. Price D1 D Quantity
5. The Boomerang Manufactures decide to add a money back guarantee on their product, which increases the popularity for them. Price D1 D Quantity
6. Many Pago-pagans begin to believe that they may lose their jobs in the near future. (Think expectations!) Price D D1 Quantity
7. Come up with your own story about boomerangs and the Pago-Pagans. Write down the story, draw the change in demand based on the story, and explain why demand changed. Price D Quantity
1. The government of Pago-Paga adds a subsidy to boomerang production. Price S S1 Quantity
2. Boomerang producers also produce Frisbees. The price of Frisbees goes up. S1 Price S Quantity
3. The government of Pago-Paga adds a new tax to boomerang production. S1 Price S Quantity
4. Boomerang producers expect an increase in the popularity of boomerangs worldwide. Price S S1 Quantity
5. The price of plastic, a major input in boomerang production, increases. S1 Price S Quantity
6. Pago-Pagan workers are introduced to coffee as Pago-Paga become integrated into the world market and their productivity increases drastically. Price S S1 Quantity
7. Come up with your own story about boomerangs and the Pago-Pagans. Write down the story, draw the change in supply based on the story, and explain why supply changed. Price S Quantity
Supply and Demand at Work • Markets bring buyers and sellers together. • The forces of supply and demand worktogether in markets to establish prices. • In our economy, prices form the basis of economic decisions.
Supply and Demand at Work • Supply and Demand Schedule can be combined into one chart.